Lessons from the European Union’s inaugural Hydrogen Bank auction
This is the second installment of the Topic of the Month: A new stage for the EU gas market
The second instalment of our Topic of the Month on the EU gas market focuses on the first auction results from the Hydrogen Bank and is written in collaboration with Bruegel. The article was originally published on the Bruegel website.
The EU’s first subsidy auction for renewable hydrogen went about as well as could have been hoped.
Millions of tonnes of fossil hydrogen are produced in the European Union using natural gas as a feedstock, resulting in roughly 12 tonnes of carbon dioxide emissions for every tonne of hydrogen. Production of hydrogen using water and renewable electricity can eliminate those emissions, but currently costs substantially more. To bridge some of that cost gap, or ‘green premium’, the EU has developed the European Hydrogen Bank (EHB), a subsidy mechanism to support the production of renewable hydrogen, aiming to increase private investment within the EU and globally 1 .
The EHB is a ‘pay-as-bid’ auction mechanism, with prospective hydrogen producers bidding for a fixed subsidy per kilogramme of renewable hydrogen produced. Importantly, all bids must include credible evidence of preliminary contractual agreements with buyers. The first auction closed on 30 April 2024 and allocated €720 million to seven renewable hydrogen projects, with an additional €2.2 billion reserved for a second auction.
Winning bids were lower than expected. This means the EHB pot can support greater volumes than anticipated, though these volumes remain very small in the context of political targets 2 .The low bids also imply some buyers are willing to pay a large share of the ‘green premium’ for renewable hydrogen over fossil hydrogen.
Notably, winning bids all originated from the Iberian Peninsula or the Nordics, areas with competitive renewable energy resources. This suggests a strong investment pull effect from renewable availability 3 .
Political ambition exceeds joint funding reality
Assuming that winning projects go ahead and similar bids are submitted in the second auction round later this year, the EHB’s endowment of €3 billion should translate into annual production of around 0.7 million tonnes (Mt) of renewable hydrogen by 2030 (with 6GW of electrolyser capacity). For context, the 2020 EU Hydrogen Strategy set a target to produce 10Mt of renewable hydrogen by 2030.
Specific and binding sectoral targets were agreed by the European Council in the revised Renewable Energy Directive (RED, EU/2023/2413) (Robinson and Laurencin, 2023). For industry (like ammonia producers), 42.5 percent of the hydrogen supply must be renewable by 2030. Renewable hydrogen products should constitute at least 1 percent of fuel supplied to the transport sector by 2030. We calculate that these obligations amount to roughly 4Mt of clean hydrogen demand, based on current fuel demand in these sectors. Figure 1 illustrates that the EHB alone is insufficient for reaching those targets.
Figure 1: 2030 renewable hydrogen targets and estimated Hydrogen Bank support (Mt)
Large private companies’ willingness to pay for renewable hydrogen
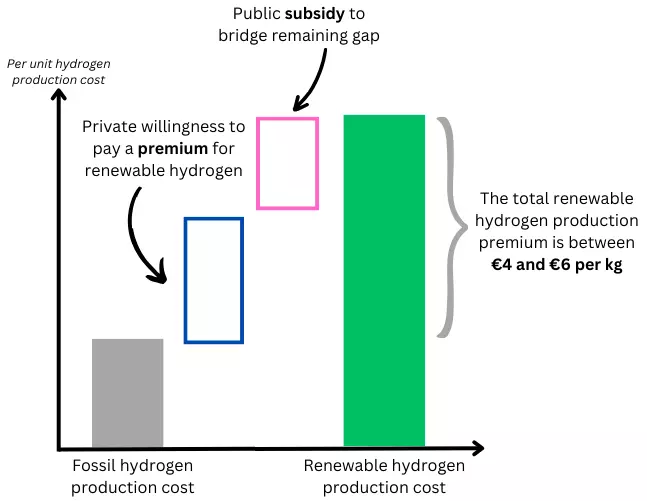
The cost of producing renewable hydrogen in Europe exceeds that of fossil (natural gas-based) hydrogen by between €4 and €6 per kilogramme. The EHB set a first-round subsidy ceiling price of €4.50/kg, roughly equivalent to the green premium needed for the most competitive projects. However, the winning bids were less than 10 percent of this, at an average of €0.40/kg, meaning that the remaining 90 percent of the green premium is being covered by the end consumer and some other supply-side support we will discuss later. We can infer from these results that some European buyers are willing to pay a substantial premium for renewable hydrogen over fossil hydrogen (the blue box in Figure 2 is tall relative to the overall cost indicated in green).
This is good news for two reasons. First, it demonstrates that renewable hydrogen does not need to reach price parity with fossil hydrogen (or even close) to begin displacing meaningful volumes of the fossil incumbent. Second, the burden of narrowing that cost gap does not need to be carried solely by public funds.
Figure 2: Logic of the renewable hydrogen premium and public subsidy

Source: Bruegel.
For context, the winning bid prices in the EHB auction were a fraction of the roughly €11/kg subsidy for winning bids in the UK’s latest renewable hydrogen auction round, and well below the United States tax credit of $3/kg, which was created under the Inflation Reduction Act. This preliminary information suggests that the EU is getting very good value from its limited funds. The use of a competitive auction design helps, with projects receiving what they ‘need’ rather than what they ‘want’. Regulations that require existing fossil hydrogen consumers to switch to renewable hydrogen (ie the RED) also help.
Two caveats apply here. First, European projects receive further non-Hydrogen Bank financial support. From 2025, renewable hydrogen producers will be considered like their fossil counterparts in the EU emissions trading system (ETS). Consequently, they will receive a share of free carbon allowances. Fossil hydrogen producers must use the allowances to compensate for their carbon emissions, but for renewable producers with no emissions to declare, these allowances can be sold for profit. The action is intended to create a level playing field whilst allowing the carbon price to function. We calculate that these could be worth roughly €0.7/kg based on recent ETS prices, although the number of free credits allocated will already begin to be phased down from 2026.
Second, the winning bids from this first auction round should be operational by 2028 and therefore exempt for 10 years from the obligation to comply with the ‘additionality’ principle for renewable electricity generation 4 . The exemption allows projects to use previously subsidised renewable electricity capacity, which comprises a large share of the capital investment for a renewable hydrogen project. This additional cost will be relevant for future projects (though second-round winners are also likely to be exempt).
Renewable pressures for the map of industrial geography
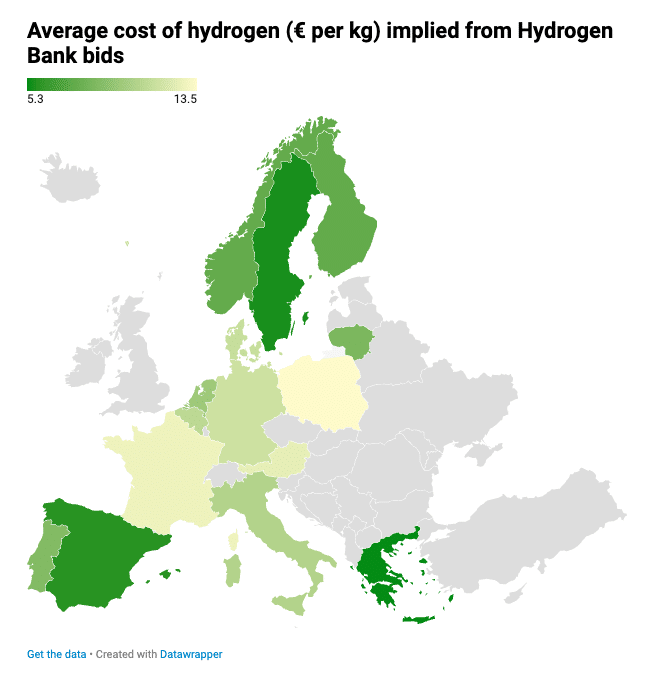
The most competitive bids were clustered in the northernmost and southernmost regions of the EU (illustrated by darker green shading in Figure 3), where renewable electricity is the cheapest. This supports the ‘renewable pull’ hypothesis for energy-intensive manufacturing industries, for which theoretical evidence is provided by Verpoort et al (2024).
Figure 3: Average cost of hydrogen (€/kg) implied from Hydrogen Bank bids

The disbursement of EU support for clean technologies is geo-agnostic and driven by techno-economic analysis to identify the most competitive projects. That is the case both for the EHB and the broader Innovation Fund, which supports green tech 5 . If competitiveness is increasingly determined by a ‘renewable pull’, difficulties will arise in reconciling European economic efficiency with national political interest.
An innovative feature of the EHB is its offer for ‘auctions-as-a-service’. Participating countries can contribute domestic funds to the wider European auction, which are then used to support their most competitive domestic bids that did not clear under the European-wide budget threshold. This financial support benefits from special treatment under state aid procedures (European Commission, 2024).
The EHB auctions-as-a-service mechanism means countries can use national subsidies to protect or grow domestic hydrogen production. Germany is the sole country to have used this feature so far, contributing €350 million 6 through auctions-as-a-service to support 0.09 GW of domestic projects in the first round. The same €350 million distributed to the most efficient European project would have supported approximately 0.7 GW or around eight times more capacity. Austria is reportedly 7 also poised to contribute €400 million to clear domestic projects at a similar bid price to Germany.
A tension may emerge between regions with natural competitiveness for renewably fuelled energy-intensive sectors and fiscally powerful countries with existing competitiveness in fossil-fuelled energy-intensive sectors. Striking the correct balance between exploiting areas of renewable abundance while managing existing areas of industrial agglomeration, across the European Union, will be essential. Nevertheless, the results of the first EHB auction were as positive as could have been hoped for the EU’s clean hydrogen goals.
References
Eicke, L., N. Kramer and R. Quitzow (2023) ‘How Decarbonization Will Transform the Geography of Industrial Production: New Evidence on the “Renewables Pull” Hypothesis’, RIFS Blog, 29 December, available at https://www.rifs-potsdam.de/en/blog/2023/12/how-decarbonization-will-transform-geography-industrial-production-new-evidence#
European Commission (2024) ‘Auctions-as-a-Service for Member States’, Concept Note, available at https://climate.ec.europa.eu/system/files/2023-11/policy_funding_innovation_conceptpaper_auctionsasaservice.pdf
Robinson, C. and C. Laurencin (2023) ‘Europe back in the driving seat? Europe agrees on renewable hydrogen consumption targets’, S&P Global Blog, 5 April, available at https://www.spglobal.com/commodityinsights/en/ci/research-analysis/back-in-the-driving-seat-europe-agrees-on-renewable-hydrogen-c.html
Verpoort, P.C., L. Gast, A. Hofmann and F. Ueckerdt (2024) ‘Impact of global heterogeneity of renewable energy supply on heavy industrial production and green value chains’, Nature Energy 9: 491-503, available at https://www.nature.com/articles/s41560-024-01492-z


