



The Long-Term Sustainability of Metals Markets: The Case of Copper

Copper is essential to electrification, economic development and the expansion of digital infrastructure. As demand grows, concerns about future copper shortages are becoming increasingly prominent. Yet projections of supply deficits do not necessarily imply that copper resources are being exhausted or that persistent shortages are inevitable. The long-term sustainability of copper markets depends on how investment, production capacity, technology and demand respond to changing market conditions, and on the time required for these adjustments to occur.
Recent studies have examined how the availability and quality of known resources, extraction costs and demand pathways influence long-term copper supply (Castillo and Eggert, 2020; Guj and Schodde, 2025). As discussed in our recent Cover the Basics (FSR, 2026), depletion does not necessarily imply the physical exhaustion of resources; it may instead be reflected in rising extraction costs. Therefore, an important distinction is between the physical availability of copper and the quantities that can be economically supplied. Moreover, reserves are dynamic: they evolve with exploration, geological knowledge, technology and economic conditions (USGS, 2026).
As Peyret (2026) suggests, the long-term sustainability of metals markets depends, among other factors, on the responsiveness of demand to prices, technological progress that enables supply to expand, and the ability of prices to signal resource scarcity. The question is how effectively these adjustment mechanisms can operate when demand is growing rapidly.
Drivers of growing copper demand
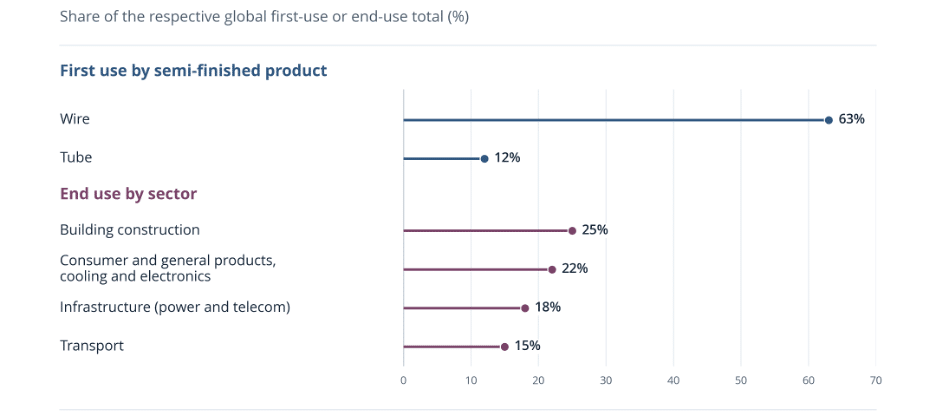
Global copper demand is expected to increase substantially, driven by economic development, urbanisation, electrification and the expansion of digital infrastructure (see Figure 1). Between 2020 and 2050, growth in the global urban population will require significant investment in housing, transport, water systems and other infrastructure, all of which are metal-intensive. In the IEA’s 2026 Stated Policies Scenario, copper records the largest increase in volume among key energy-transition minerals, adding approximately 7 million tonnes of demand by 2040, driven particularly by electricity networks and next-generation technologies (IEA, 2026a). Electric vehicles require approximately 2.9 times as much copper as conventional vehicles, while the expansion of digital infrastructure represents an additional source of demand (S&P Global, 2026). S&P Global (2026) estimates that annual copper demand associated with data centres could increase from 1.1 Mt in 2025 to 2.5 Mt by 2040.
Electricity networks are particularly important in this context. According to S&P Global (2026), annual copper demand associated with transmission and distribution networks and transformers could increase from approximately 4.3 Mt in 2025 to 7.1 Mt by 2040. The IEA (2026b) estimates that global annual investment in electricity grids, currently around USD 400 billion, would need to increase by approximately 50% by 2030 to meet projected electricity demand. In Europe, distribution networks face significant investment requirements as they accommodate decentralised renewable generation, electric vehicles, heat pumps and other new electricity uses. Eurelectric (2024) estimates that average annual investment in European distribution grids (EU27 and Norway) would need to rise from approximately EUR 33 billion historically to EUR 67 billion over the period 2025–2050.
However, the implications for copper demand also depend on technological and design choices. Copper is widely used in cables, transformers and other electrical equipment, but aluminium can substitute for copper in certain applications. The extent to which network operators can respond to higher copper prices through material substitution and equipment design will influence future demand, although technical requirements may limit these options.
Can production capacity keep pace?
Whether growing demand translates into copper supply shortages depends on the capacity of production to adjust. Current projections illustrate the importance of distinguishing between market balances over different time horizons and at different stages of the value chain.
The International Copper Study Group (ICSG) expects a small refined copper surplus of approximately 104,000 tonnes in 2026 and 368,000 tonnes in 2027 (ICSG, 2026a). Looking further ahead, the IEA estimates that expected mine supply from existing and announced projects could fall short of primary copper supply requirements by approximately 25% in 2035 under its Stated Policies Scenario (IEA, 2026a). Although these projections are not directly comparable (i.e., one concerns the near-term refined copper balance, while the other assesses the longer-term mine-supply pipeline against projected requirements), they nevertheless illustrate why a balanced market today does not guarantee adequate supply in the future.
The copper project pipeline faces several constraints that may limit the pace of supply expansion. Major copper discoveries have become less frequent over the past 15 years, while investment in new greenfield mines has been constrained since the commodity supercycle of the early 2010s. Developing new mines also takes considerable time. Guj and Schodde (2025) report an average period of 10–15 years between discovery and development, while the IEA estimates around 17 years from discovery to production. Consequently, few deposits currently at the exploration stage are likely to enter production before 2035.
Capital requirements have also increased substantially. According to Guj and Schodde (2025), the capital cost of developing one tonne of annual copper production capacity has risen from approximately USD 4,000 in 2000 to USD 12,000–18,000 in recent years, with even higher costs for difficult or remote projects. Declining ore grades, project complexity, infrastructure requirements and permitting can further slow the supply response.
These constraints help explain why higher prices and expectations of growing demand do not automatically translate into additional production. Investment decisions depend on the expected profitability of projects over long-term horizons, while the development of new capacity remains subject to technical, economic and institutional constraints. Hence, the risk of future supply shortfalls is closely linked to the timing and conditions of investment and capacity expansion.
Furthermore, public policy can help address some of these constraints. For copper, this includes reducing upfront investment risks, supporting enabling infrastructure and improving the efficiency and predictability of permitting procedures while maintaining environmental safeguards. The IEA (2026a) identifies investment risk reduction and infrastructure support as particularly relevant for large, liquid markets such as copper. In the EU, the Critical Raw Materials Act recognises copper as a strategic raw material and introduces measures to facilitate project development, investment and recycling, while also seeking to diversify supply and strengthen resilience. The extent to which such policy measures can accelerate capacity expansion will depend on their design and implementation.
Resource availability and the mechanisms of market adjustment
Constraints on production capacity should nevertheless be distinguished from the physical exhaustion of copper resources. The historical evolution of resources and reserves provides an important perspective on their long-term availability.
Mudd and Jowitt (2018) documented an increase in estimated global copper resources from approximately 1.9 Gt in 2010 to 3.0 Gt in 2015. According to the USGS (2024), global copper reserves contained approximately 1 Gt of copper in 2023, compared with around 0.3 Gt in 1995. The latest USGS (2026) estimates put global reserves at approximately 0.98 Gt in 2025, broadly consistent with the 2023 estimate. Such figures reflect the dynamic nature of reserve estimates, which respond to changes in geological knowledge, technology and economic conditions.
The ICSG (2023) considers the physical exhaustion of copper resources highly unlikely, emphasising the contribution of exploration, technological progress and recycling. Similarly, Guj and Schodde (2025) suggest that potential future supply constraints are more likely to arise from insufficient production and processing capacity than from the physical depletion of copper resources.
Market adjustment can also occur through technological progress, substitution and recycling. Advances in crushing, coarse-particle recovery, sulphide leaching and process control using AI can improve productivity and recovery rates in mining and processing. Substitution, including aluminium for copper in certain applications, can moderate demand where technically and economically feasible.
Recycling provides another source of supply. According to the ICSG (2026b), secondary copper produced from scrap accounted for approximately 19% of global refined copper production in 2025. Sustained high copper prices can strengthen incentives for collection and recycling, while product design and end-of-life regulations can facilitate material recovery. However, recycling depends on scrap availability, collection, and processing capacity. Given the long lifespan of copper-containing products and continued growth in demand, primary production and recycling are likely to remain complementary for the foreseeable future.
These mechanisms can help the market accommodate growing demand, but their contribution depends on their economic feasibility and the time needed for them to operate. Higher prices can encourage new investments and changes in consumption, while technological progress and recycling can expand the economically available supply of copper. Their combined effects will influence future market balances, although they cannot be assumed to eliminate potential supply constraints within any given timeframe.
Conclusion
Projected demand growth and potential supply gaps do not, in themselves, establish that copper markets face an inevitable or persistent shortage. The evolution of resources and reserves, technological progress, recycling and substitution all provide scope for market adjustment. At the same time, long project development periods, rising capital requirements and other constraints on capacity expansion mean that these adjustments may not occur quickly enough to meet projected demand.
The long-term sustainability of copper markets will depend on both the scale and timing of investment and the responsiveness of supply and demand to changing market conditions, as well as the policy frameworks that influence these adjustments. Assessments of future shortages need to account for these adjustment mechanisms and their limitations, rather than treating projected supply gaps as predetermined outcomes.
References
- Castillo, E., & Eggert, R. (2020). Reconciling diverging views on mineral depletion: A modified cumulative availability curve applied to copper resources. Resources, Conservation and Recycling, 161, 104896.
- Eurelectric (2024). Grids for Speed. Union of the Electricity Industry – Eurelectric, Brussels, May 2024.
- European Parliament and Council of the European Union (2024). Regulation (EU) 2024/1252 of 11 April 2024 establishing a framework for ensuring a secure and sustainable supply of critical raw materials. Official Journal of the European Union, L, 2024/1252.
- Florence School of Regulation (FSR) (2026). Why the Economics of Metals Matters More Today Than Ever. Cover the Basics, European University Institute.
- Guj, P., & Schodde, R. (2025). Will future copper resources and supply be adequate to meet the net zero emission goal? Geosystems and Geoenvironment, 4(1), 100320.
- International Copper Study Group (ICSG) (2023). Long Term Availability of Copper. Lisbon: ICSG.
- International Copper Study Group (ICSG) (2026a). ICSG Copper Market Forecast 2026–2027. Press Release, 14 October 2026. Lisbon: ICSG.
- International Copper Study Group (ICSG) (2026b). The World Copper Factbook 2026. Lisbon: ICSG.
- International Energy Agency (IEA) (2026a). Global Critical Minerals Outlook 2026. Paris: IEA.
- International Energy Agency (IEA) (2026b). Electricity 2026. Paris: IEA.
- Mudd, G. M., & Jowitt, S. M. (2018). Growing global copper resources, reserves and production: Discovery is not the only control on supply. Economic Geology, 113(6), 1235–1267.
- Peyret, M. (2026). Essays in Metal Economics – Sustainability and Markets, PhD Dissertation University Paris Dauphine-PSL.
- S&P Global (2026). Copper in the Age of AI: Challenges of Electrification. S&P Global Energy & Market Intelligence, January 2026.
- S. Geological Survey (USGS) (2024). Mineral Commodity Summaries 2024: Copper. Reston, VA: USGS.
- S. Geological Survey (USGS) (2026). Mineral Commodity Summaries 2026: Copper. Reston, VA: USGS.
- Source : Guj et Schodde (2025).
Don’t miss any update on this topic
Sign up for free and access the latest publications and insights
More on the topic