Some reflections on current gas market price trends
This is the fourth installment of the Topic of the Month: Decarbonising gas markets
High energy prices are currently one of the main issues in the EU’s political agenda. Particular attention is paid to natural gas markets, as unprecedented gas price increase has influenced electricity prices. Today nearly three-quarters of the EU Member States activated support mechanisms to the vulnerable customers, but political debate looks far beyond it. Some Member States are seriously challenging existing energy market designs.
Natural gas and electricity prices, as for other commodities, are primarily a function of supply and demand in the market. A high natural gas supply over demand would result in lower prices and vice versa.
The supply of the EU in natural gas takes place via a network of pipelines, mainly from Russia, Norway and Algeria, or it can be shipped as liquefied natural gas (LNG) towards the EU LNG terminals. Natural gas is typically purchased and stored during the period of low prices and low or normal demand, i.e. in warm months, in order to be sold to consumers. The trading of natural gas (either OTC or via exchange) happens in two main distinct markets: the spot market and the futures market, where gas can be purchased one month before its delivery.
1. Recent trends in the natural gas spot market
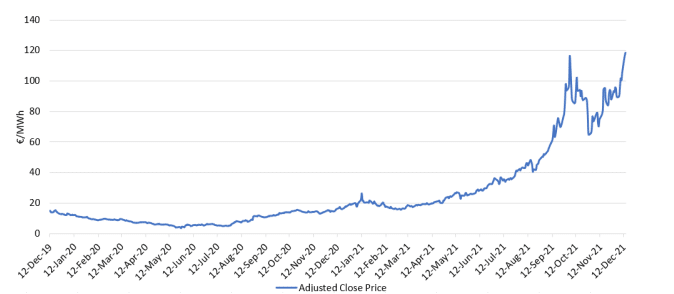
To reflect on the past years supply-demand dynamic, we show in Figure 1, for the period between December 12th, 2019 and December 14th, 2021, the Dutch TTF spot prices, for day-ahead delivery, being the European benchmark price for natural gas.

Following the Covid-19 pandemic and its related restrictions, in beginning of 2020, there was a drop in demand for natural gas and energy in general. As a result the TTF natural gas prices experienced record-low prices going as low as a little over 3.5 €/MWh in May 2020.
Yet the era of low natural gas prices seems now part of history. Indeed the recovery of economic activities was translated into increased energy demand, and natural gas prices regained their pre-pandemic levels by Q3/Q4 2020. The upward trend continued in 2021, and European gas prices hit all-time highs of 116 €/MWh in October 2021: unthinkable two years ago.
Following this, there was a small decrease in the prices by the end of October/beginning of November for natural gas before continuing their upward trend in the second half of November 2021, amid concerns regarding forecasts for a cold winter. On December 14th 2021, the Dutch TTF prices broke October’s all-time high record price to reach 118.36 €/MWh.
On average, between 2019 and September 2021, the EU wholesale natural gas prices increased by 429% (European Commission, 2021a). This had repercussions on wholesale electricity prices, whose EU average jumped by 230% during the same period.
2. Is the storm over?
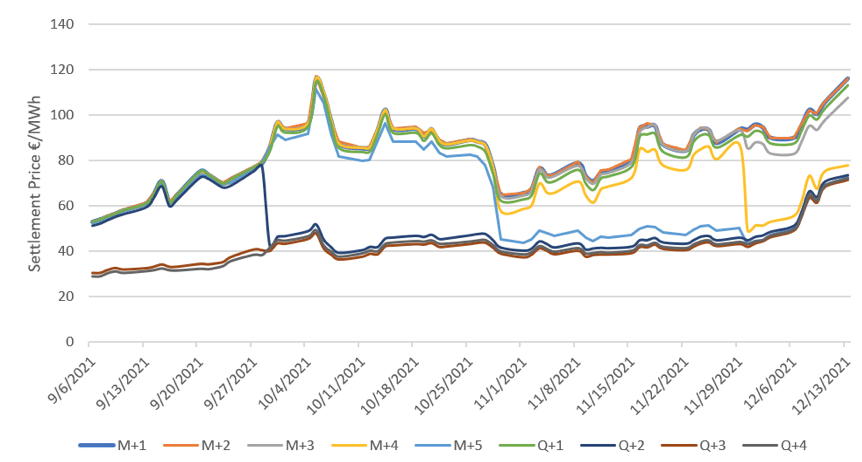
Looking at the futures contracts with delivery at M+1 to Q+4, shown in Figure 2, we see that futures with delivery during this winter follow the trend of spot prices, sending a signal that a costly winter might be coming. Yet, for the contracts with a delivery that is after the winter, the prices are significantly lower. Future contracts are closely linked to weather forecasts, supply and demand future balance as well as inventory levels.

From Figure 2, we can see that prices for winter 2021/2022 are up to a similar scale to spot prices. Yet for Q+2 and beyond, future prices increase to a lesser extent, as they will not cover this winter season. For the spring of next year, natural gas prices seem to go towards a lower level, highlighting the fact that markets are currently reacting to a short-term shortage in marge of the concerns on the severeness of the starting winter season. There seems to be no excitement in the longer term, and market participants seem to expect that there will be sufficient supply beyond the winter season.
Nevertheless, at the beginning of December 2021, there was a surge of the different future contracts, including those for Q+2 and beyond, following the surge of the spot prices levels. This surge is driven by the same reasons as spot prices. In addition, this increase in future contract prices reflects the increasing fear of a tight supply for the winter season.
3. Storage levels of natural gas
In the current prices spikes crisis, gas storage has often been in the spotlight, mainly due to its capacity to fulfil gas demand in cases of supply disruption or extreme weather events. This was the case, for instance, in winter 2020-2021, with 720 TWh of gas withdrawn from storage facilities in Europe (GIE, 2021a).
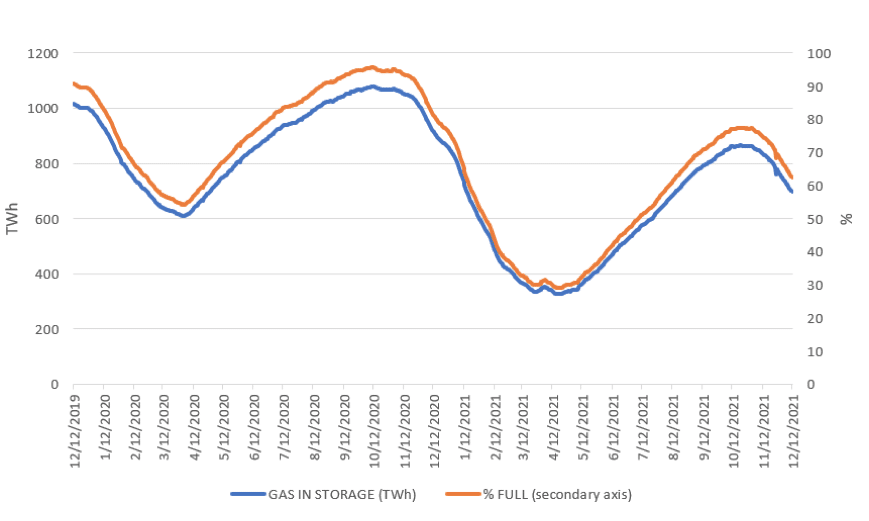
This year, pre-winter gas storage levels in the EU were at 77% of capacity[1], while they were at 95% last year during the same period, as shown in Figure 3. The 2021 pre-winter levels are the lowest for this period since 10 years, being around 90% usually. The closest year for such low levels of storage in this period was 2015, where gas storage levels were at 83.72% on October 21st 2015. The storage levels vary between the Member States.
Overall, storage levels rose steadily since the end of last winter following their pre-winter yearly trend, but to a lesser extent. Looking at the previous years, natural gas withdrawals from storage generally start in the first or second week of November, which was the case for this year.
On December 12th the gas storage levels in the EU stood at 62.41%, while it stood at 81.43 % on the same day of 2020 and 90.93% on the same day of 2019 (GIE, 2021).

4. Other factors impacting high energy prices globally
First, natural gas prices are increasingly linked to a global dynamic, with the increasing role of LNG vis-à-vis pipelines systems. Prices surges, therefore, have an increasingly global correlation between countries that are not necessarily interconnected. The EU prices are a reflection of this trend. In fact, natural gas demand increased globally over the past months. Added to this, the Covid-19 pandemic restrictions and the falling demand have slowed down investments in upstream oil and gas, being near-record low (IEA, 2020). The 2021 natural gas upstream spending is higher than 2020 but still lower than in 2019 (IEA, 2021a). Then, with the reopening of economies, demand rose quickly following the pandemic and the natural gas producers are struggling to ramp up fast their production after the investment delays.
Weather driven demand also plays a strong role in this crisis, as there were significant cold spells in Asia and North America in early 2021.. Later on, the warm summer in some Asian countries has increased their demand due to more natural gas being burned to produce the electricity needed to cool houses (The Economist, 2021).
In addition to the surging demand, the tight supply contributed to the current situation. The EU gas production was 8% lower in Q2 2021 compared to the previous year. The Netherlands’ production was 10% lower year-on-year due to the drop in Groningen field output that is planned to close by mid-2022 due to seismic activity. Norway had also maintenance works slowing down its gas production, which fell by almost 9% between Q2 2020 and Q2 2021 (European Commission, 2021b).
Last but not least, imports from Russia, the largest EU natural gas supplier, had a moderate increase in Q2 2021 compared to the previous year rising by 5% (European Commission, 2021b). While Russia has fulfilled its contractual commitment with EU Member States, there were questions on why it did not boost its exports to benefit from the skyrocketing prices, especially as there are important available transport capacities (ACER, 2021). Different reasons could explain this. First, Russian production sites could be running at their maximum capacities, e.g. due to delayed maintenance works and lower upstream investments due to the pandemic. Russian companies upstream oil and gas spending are expected to reach 27 billion USD in 2021, a mild increase compared to the 24 billion USD in 2020 and less than the 32 billion USD spending in 2019. Second, Russia could be more interested in selling natural gas to Asian countries that are also subject to high prices. Also, high Russian domestic consumption could explain the marginal increase in exports. Finally, with the heating seasons starting, Russia could favour refuelling its inventory to higher levels and generating electricity for its internal demand.
Conclusion
The EU natural gas market seems to work properly as the current price spikes are mainly due to high demand and a tight supply situation that provides investment signals.
Such prices spikes have nevertheless attracted unusual attention to energy markets and discomfort for politicians and regulators. Unfortunately, it seems that there is no magic solution that would decrease these prices next month. The situation remains volatile and requires close monitoring. The solution for the EU is rather not to panic and focus on direct support to vulnerable consumers and industry, not to create competition problems. The European Commission has published a toolbox, which contains measures that could be taken in support of households and industries in the situation of high energy prices (European Commission, 2021).
For the winter season, prices may stay at the same level or even increase. An increase in imports from Russia may ease the price spikes, but nothing much more. However, the security of supply is not at immediate risk. The current assessments are closely linked to the severeness of the winter season and the sustainability of the required level of gas supply. A worst-case situation may lead to demand curtailment and the triggering of the Security of Supply Regulation, e.g. via the solidarity mechanism.
[1] Source: Gas Infrastructure Europe
Bibliography
ACER, 2021. HIGH ENERGY PRICES.
EURACTIV, 2021. New German government repeats old fallback positions on Nord Stream 2 [WWW Document]. URL https://www.euractiv.com/section/energy/news/new-german-government-repeats-old-fallback-positions-on-nord-stream-2/
European Commission, 2021a. Tackling rising energy prices: a toolbox for action and support.
European Commission, 2021b. Quarterly Report Energy on European Gas Markets (issue 2, second quarter of 2021).
GIE, 2021a. Picturing the value of underground gas storage to the European hydrogen system.
GIE, 2021b. AGSI+ [WWW Document]. URL https://agsi.gie.eu/#/graphs/eu
IEA, 2021. World Energy Investment 2021.
IEA, 2020. World Energy Investment 2020.
Powernext, 2021. Futures market data [WWW Document]. URL https://www.powernext.com/futures-market-data
GIE, 2021. AGSI+ [WWW Document]. URL https://agsi.gie.eu/#/graphs/eu
The Economist, 2021. Natural-gas prices are spiking around the world [WWW Document]. URL https://www.economist.com/finance-and-economics/natural-gas-prices-are-spiking-around-the-world/21804953
Yahoo Finance, 2021. Dutch TTF Natural Gas Calendar (TTF=F) [WWW Document]. URL https://finance.yahoo.com/quote/TTF%3DF/history?p=TTF%3DF


