

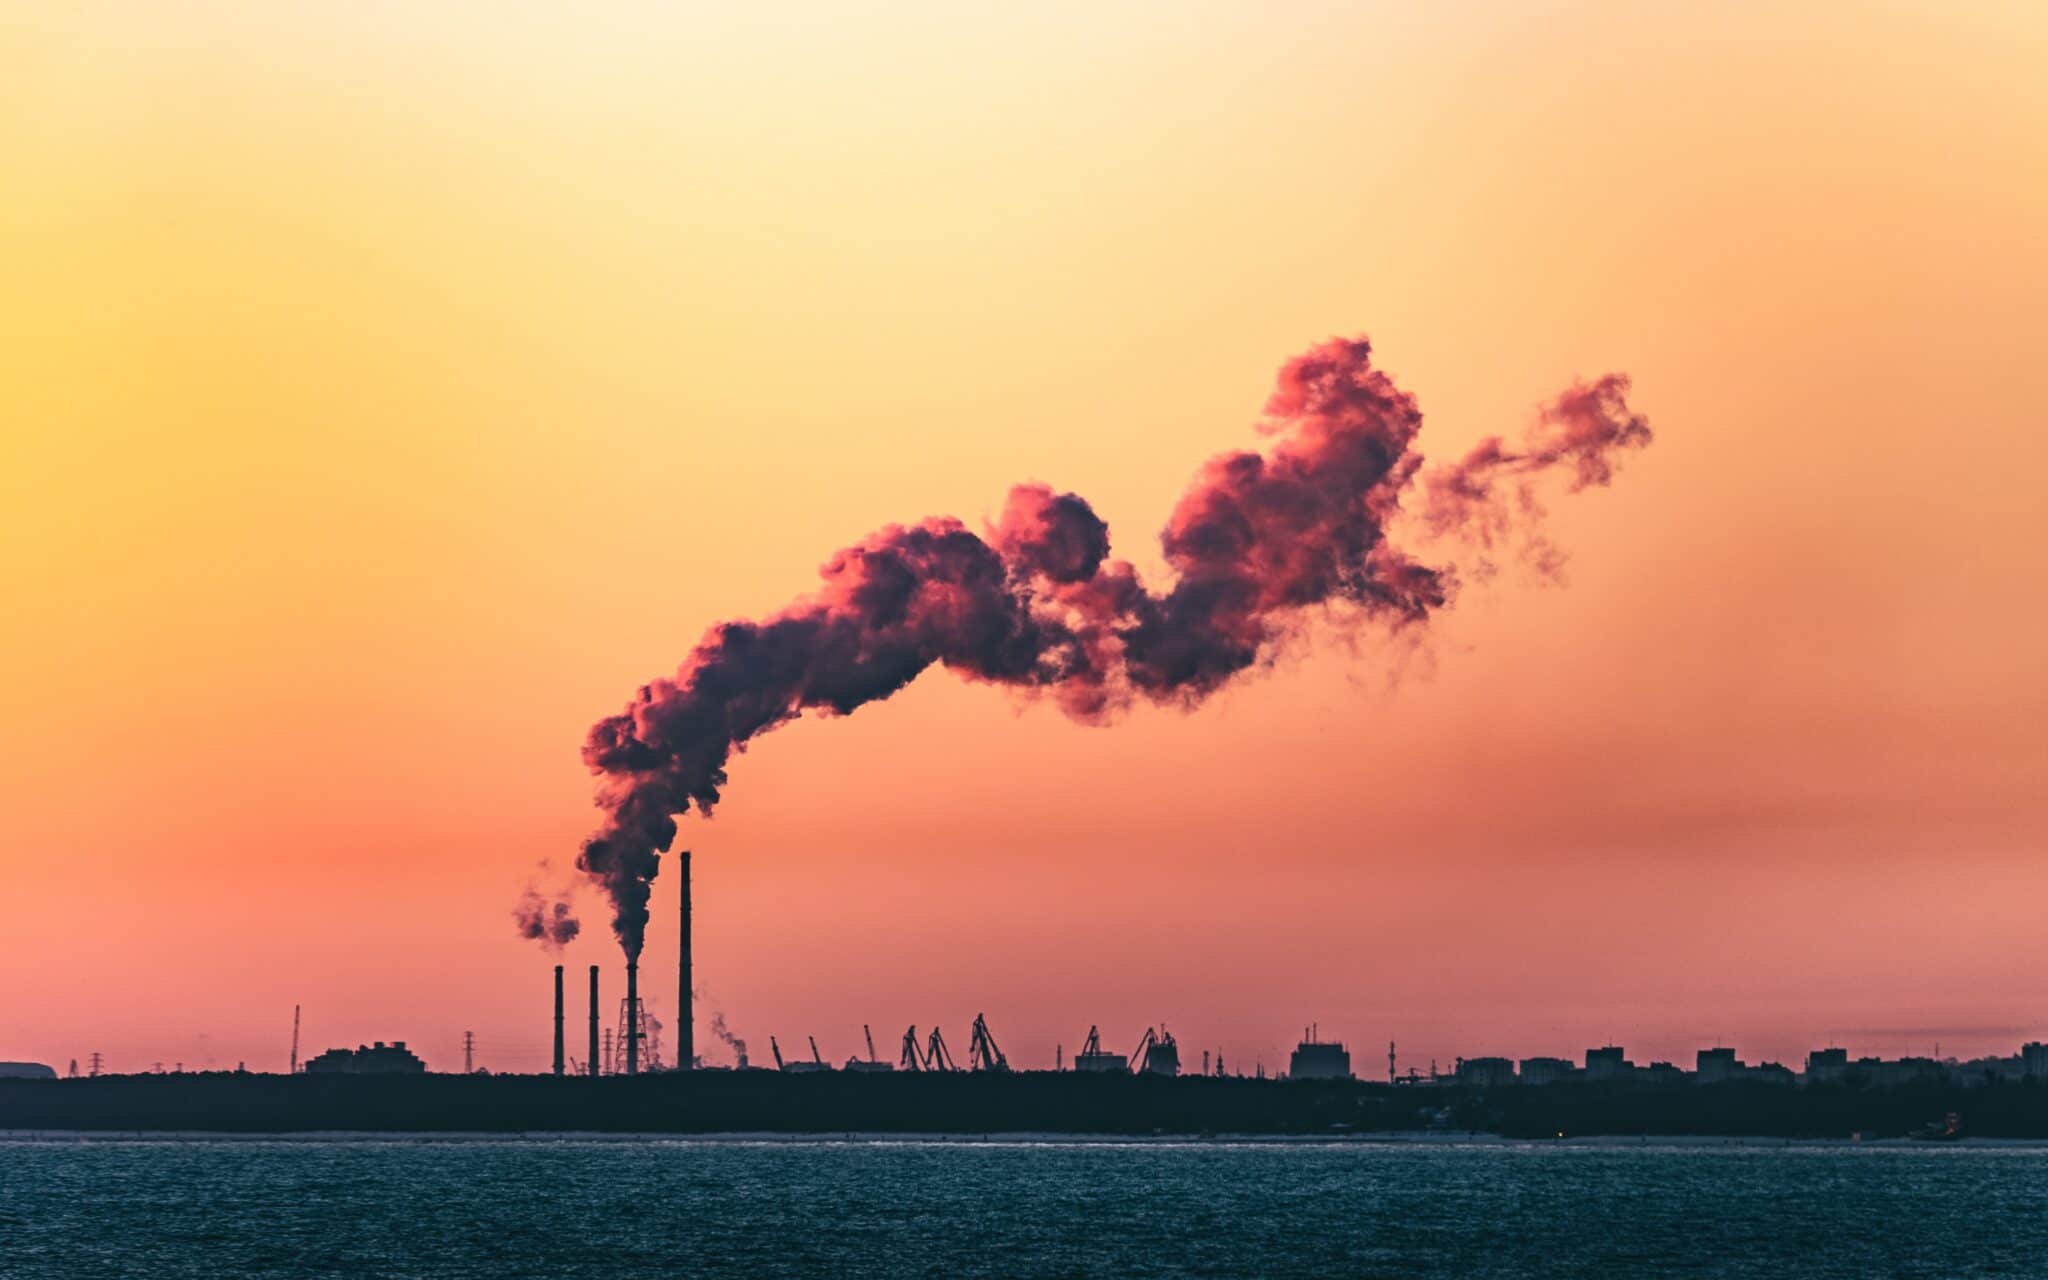
Policy implications of 2022 Cost-effective Decarbonisation Study
Following FSR publication of its 2022 ‘Cost-effective Decarbonisation Study’, we raise eight points for consideration in the context of energy sector decarbonisation.
Last month, the FSR published an update[1] to the 2020 ‘Cost-effective Decarbonisation Study’[2], utilising the latest data and estimates on renewable electricity (RES-E) price and capacity as well as hydrogen cost and deployment options. On the basis of this work, the following opinion piece proposes 8 considerations for energy sector decarbonisation, with a focus on regulatory and market support measures for renewable, low-carbon hydrogen, and carbon negative hydrogen. The full version of the study can be found here.
1. Decarbonisation efforts should follow a strict hierarchy
The decarbonisation study notes that renewable electricity produced in the EU will likely remain scarce (i.e. fall short of overall EU electricity demand) for many years to come, likely until ~2045. Whilst this remains the case, use of these electrons should be highly targeted and prioritise their most efficient and effective allocation.
The EU Energy Efficiency First (EEF) principle3 sets the entry point for decarbonisation of the energy sector, but it can be expanded to a merit order of decarbonisation options to guide further decision-making rationale. We advocate for the following decarbonization approach.[4]
- Avoid energy consumption where possible: The first priority should be to reduce overall demand, both in terms of energy intensity, but also in absolute terms. This is essentially the EEF principle, but progress in this area has been slow, despite being prioritised in targets and policy.[5]
- Decarbonise existing electricity demand as quickly as possible: Renewable electricity will be the basis of a future sustainable energy system, and as such it is the foundation upon which all other energy vectors and uses will be based. The success or failure of endeavours to reach a net-zero compatible energy system will stand or fall by our ability to substitute fossil generation with renewable electricity. Recent analysis illustrates it is virtually impossible to build ‘too much’ renewable energy capacity at this point.6
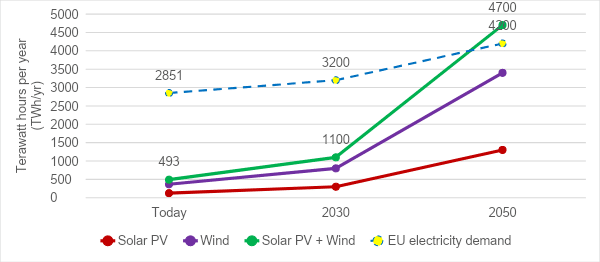
- Electrify wherever possible: The fundamental principles of thermodynamics state that every time energy is converted from one form to another, there is a loss of energetic content between the two states. If we understand renewable electricity to form the basis of our energy system, anytime this is converted into something else there will be losses, thus requiring greater and greater quantities of renewable electricity. With this in mind, electrification of demand should be a priority, wherever practicable – particularly whilst renewable energy remains scarce (see Figure 1). Conversion of RES-E to other energy vectors (e.g., renewable hydrogen) should be used as a last resort, and where it adds the most value.
2. Energy prices key to hydrogen cost-effectiveness, more than carbon price
Based on coherent cost estimates, green hydrogen is expected to be more expensive than blue hydrogen for at least the next decade, beyond certain optimal operating conditions for electrolysers, or exceptionally high gas prices (see Figure 2).[7]
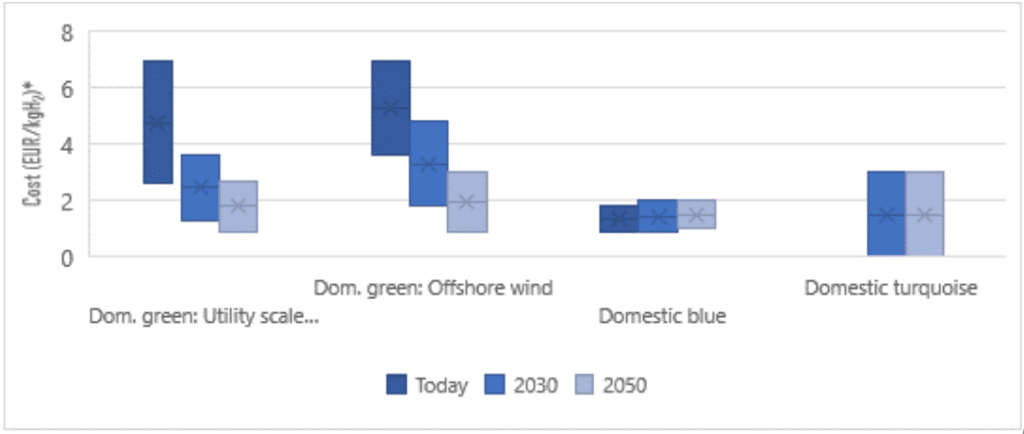
This is largely due to the anticipated relative cost and availability of natural gas versus renewable electricity. However, by 2030, green hydrogen may theoretically be competitive with blue and grey hydrogen, if renewable electricity prices can fall sufficiently, relative to the cost of natural gas. For example, under the very high natural gas prices experienced in Europe during the second half of 2021, green hydrogen has consistently been more competitive than blue and even grey hydrogen.[8], [9] If these market conditions were to persist, or restabilise at lower but similar levels, green hydrogen would be competitive with blue hydrogen much more quickly. Nevertheless, it should be noted that the IEA expects the gas price to return to normal levels relatively quickly.[10]
Indeed, there are large discrepancies in the projected costs and capacities of different RES-E technologies, wind vs solar, offshore vs onshore, pyrolysis vs electrolysis, etc., as well as trajectories for biomethane costs. The cost (but not necessarily the market price) of RES-E from all sources is projected to decrease considerably in the coming years, but with competitive prices from offshore wind coming the latest (see Figure 3). This in itself is an important point. The price that renewable hydrogen manufacturers will have to pay for RES-E in the EU will not be dependent on the cheapest cost of producing new capacity in the most favourable part of the EU. Rather, so long as RES-E is ‘scarce’, it will be set by the forward electricity price.
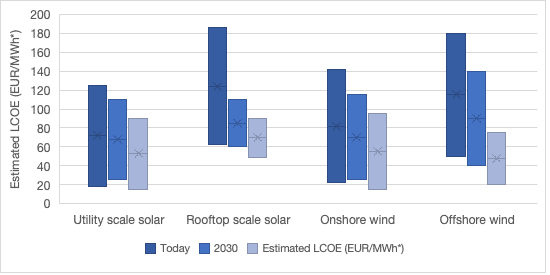
In this view, solar PV is seemingly the most financially competitive electrolysis option in the medium term (2030) with wind becoming more relevant by 2050.[11] This is notwithstanding other potential challenges at scale, such as water stress, competition for land use, and even the potential impacts of climate change on wind speeds and solar exposure.[12] Moreover, due to the different daily production patters of wind versus solar relative to demand patterns, wind may end up being the more attractive supply source in some circumstances. This is because wind power continues to be generated at night when overall electricity demand is lower, often leading to lower electricity prices and lower risk of high opportunity costs[13] in the allocation of renewable electricity.
Turquoise hydrogen potentially shows the most promise in terms of cost decrease, with considerably less sensitivity to fluctuations in energy price than blue or green hydrogen, as it requires less electricity than electrolysis and less gas than SMR with CCS.[14] When bio-methane is part (or all) of the feedstock, the hydrogen produced can be carbon-negative. Arguably the key variable for pyrolysis is the value of the co-product, carbon black, with 3 kg of solid carbon produced for every kg of hydrogen. Low quality carbon black has a value of ~4.30 EUR/kg, but higher quality graphene is ~150 EUR/kg and carbon nanotubes are ~2,000 EUR/kg.[15]
Overall, the carbon black market is expected to grow considerably in the coming years, due to demand from the automotive and electronics sectors. An additional source of potential demand is for soil improvement, which can capture additional GHG and be an important part of the EU’s farming strategy and circular economy objectives. If a relatively good quality of carbon can be produced at scale, the hydrogen may become the by-product, as it is in certain industrial processes today. However, if methane pyrolysis was rolled out commercially, it may also depress carbon product prices due to market saturation.[16] The cost-effectiveness of pyrolysis could also be supported if the carbon sequestration value was reflected in financial remuneration (e.g., offset credits), where sustainable biomethane is used as a feedstock.
The data illustrates a low sensitivity of hydrogen production to ETS prices, relative to the importance of energy prices, or electrolyser costs, for example (see Figure 4). This can be seen by the exceptionally high carbon price required today to displace grey hydrogen with electrolysis powered by offshore wind energy (€320/t), versus relatively moderate ETS prices in 2030 (€120/t), when the cost of offshore wind energy is expected to be far lower, with lower cost electrolysers and higher operating efficiency.
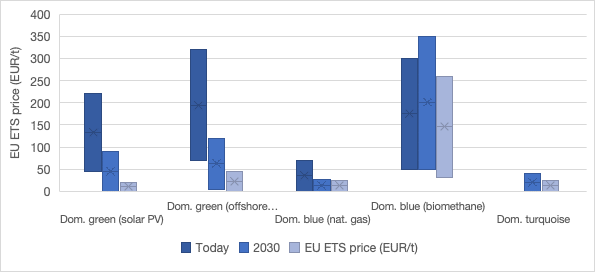
*Low value represents minimum estimated ETS price, high value represents the estimates average ETS price
Energy commodity prices remain relatively unpredictable, and cost projections for renewable energy technologies have historically been broadly inaccurate, underestimating their cost reduction potential.[17]
3. The window and applications for transitionary technologies is narrowing
As explained above, in most circumstances blue hydrogen is currently the most cost-effective decarbonised option for the hydrogen sector. Reflecting on the data, blue hydrogen however becomes financially uncompetitive against electrolysis and pyrolysis hydrogen with high natural gas prices, even with conservative 2030 assumptions for electrolyser and renewable electricity costs. Much will, therefore depend on whether gas prices drop back to ‘normal’ levels, and if so, when.
In determining the correct policy approach here, a life-cycle analysis of GHG emitted in blue hydrogen production is important. Capture rates for CCS technology show potential for improvement, but the few current plants in operation capture only roughly 80%[18] of emissions, with additional energy (typically natural gas) required for the operation of the CCS infrastructure. Moreover, there is a cost implication to transportation and storage of CO2 which needs also to be considered, assuming such a transport and storage network exists in the right places and at sufficient scale. There is limited data and high variability on what this cost might be, however, estimates for the EU are in the range of 30 – 55 euros per tonne of CO2.[19]
Finally, methane emissions along the supply chain need to be factored in.[20] Data on methane emissions from natural gas supply chains is improving all the time but remains varied in quality. From the currently available data, we can see that there are massive differences in the emissions associated with different supply chains.[21] Due to the far stronger warming potential of methane versus carbon dioxide[22, a marginal difference in supply chain methane emissions can have a more important impact on the final emission footprint of hydrogen produced than the capture rate of the CCS infrastructure.
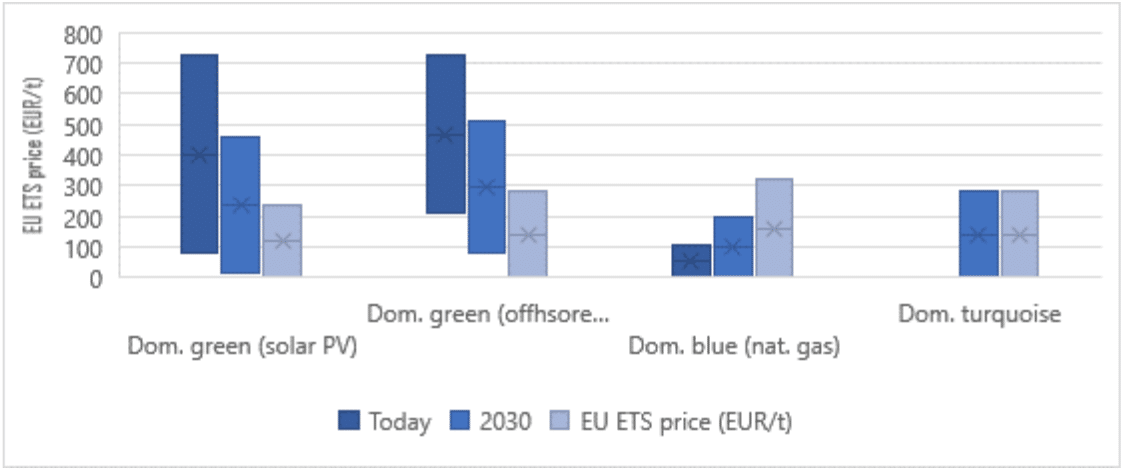
Nevertheless, CCS shows important potential to play a decarbonisation role for hard to abate during the energy transition, energy intensive sectors with unamortised assets and structural challenges to decarbonisation, potentially representing around 20% of EU GHG.[23] For example, the ETS switching costs between hydrogen and natural gas outlined in Figure 5 is very high for the next two decades and beyond, notwithstanding optimistic, and potentially unrealistic assumptions.[24]
These switching costs also ignore the infrastructure costs for energy intensive industry to switch from natural gas to hydrogen. With this in mind, it is highly unlikely that the ETS prices will justify gas to hydrogen switching until at minimum 2040. Whilst the Fit for 55 package proposes to bring these industries into the ETS combined with a CBAM[25], unless CCS is available, they will have no reasonable decarbonisation possibility available to them. This means that CCS will need to be developed for these energy intensive industries, largely situated in industrial clusters. One additional issue merits consideration here. The majority of the ~8 Mt of hydrogen currently produced in the EU[26] is from SMR[27] plants, the only option to decarbonise them is via retrofitting CCS. If this possibility does not exist due to the inexistence of a CO2 network, those companies that should be first movers in low-carbon hydrogen will have a financial incentive to continue producing unabated grey hydrogen from (unamortised) existing SMRs.
In this light, CCS has the potential to play an important and perhaps essential role as a bridging technology, particularly whilst ETS prices are below ~200 EUR/t. Given the importance of ‘front-loading'[28] GHG reductions, the EU cannot wait until the latter part of the 2040s to commence decarbonising these energy intensive industries. With only 28 years to 2050, and roughly ~25-year technology cycles, it is clear that the EU needs to decide urgently whether or not it needs to use this option, but without it, it is difficult to see how it will achieve the Green Deal targets. In an effort to avoid stranded assets and support the amortisation of fossil infrastructure by 2050, retrofitting existing SMR and energy intensive production facilities with CCS should be a priority.
The EU should be careful with the use of CCS in energy intensive industry to ensure its targeted deployment where it adds the most value[29] and set-up a regulatory framework that clearly establishes this as a transitionary tool with a clear sunset and/or obligation to be truly carbon neutral/negative by that date (for example mixing bio-methane into the gas used), by 2050.
4. Pyrolysis shows promise but needs support reflecting cross-sectoral value
As can be seen in Figure 2, turquoise hydrogen may emerge as potentially the cheapest form of zero-carbon/carbon-negative hydrogen in the future. However, this technology is at a lower level of technological maturity and relies heavily on carbon derivative product prices, adding different elements of uncertainty. Nonetheless, investments are now developing rapidly, with the US recently committing $1Bn in loan finance for the world’s biggest plant.[30]
The solid carbon output is a permanent form of stable, low-cost carbon storage, and even low-quality carbon black can be used as a soil improver, contributing to the EU’s circular economy and carbon farming objectives.[31] Graphite and rubber are currently amongst the EU’s list of ‘critical raw materials’, two products that can be produced using carbon black.[32] As such, industrial scale domestic production of methane pyrolysis can produce clean hydrogen and valuable carbon products, whilst sequestering problematic emissions from the waste and agriculture sectors, as highlighted in the EU methane strategy.[33]
Moreover, both green hydrogen and blue hydrogen suffer from certain geological, land and water use challenges. The carbon captured in CCS processes requires certain geological conditions to ensure secure long-term storage, these often do not match up with existing demand centers and industrial clusters, therefore requiring transportation of the CO2 or hydrogen.[34] As with transportation of CO2, transportation of hydrogen should also be considered in the overall emissions footprint of the product, as hydrogen is an indirect GHG and it can escape relatively easily in transit due to its very small molecular size.[35] This is an aspect of the hydrogen economy not commonly explored.
The solid carbon produced in pyrolysis is stable and easily storable, meaning it can be produced in demand centers or wherever required – mitigating much of the transport and storage concerns and costs. Green hydrogen faces challenges of freshwater availability and proximity to strong renewable energy generation conditions, whereas pyrolysis does not require freshwater. Notwithstanding these advantages, much of the information on pyrolysis technology and costs is currently only available from industry, additional R&D&D[36] is required to prove its value and scalability.
Given the potential importance of the technology, and that much of the investment to support this seems to be outside the EU, this is an area that merits EU focus.
5. Lowering technology costs through R&D&D should be the priority
The data in this study demonstrates the very high level of uncertainty regarding the future of the EU’s hydrogen market. It is not possible today to determine with accuracy the size of the decarbonised hydrogen market in 2030 and 2040, much less 2050, nor the relative share of green, blue, turquoise, or any other kind of hydrogen. Additional uncertainty is included in the forecast of grey hydrogen prices, which like blue (and to a lesser extent) turquoise hydrogen, depends significantly on uncertain natural gas prices.
On the basis of this data (underlining its illustrative nature), a logical approach would be to remain open to all decarbonised options[37], including those at demonstration phase, until the market determines the most cost-efficient hydrogen source, which in any event is likely to vary over time. However, any such approach needs to be balanced with the imperative of ensuring that zero-carbon hydrogen capacity develops quickly enough so that all relevant hydrogen demand can be supplied by zero-carbon or carbon-negative sources by 2050. In any event, our findings illustrate that under any scenario it is highly likely that green, blue, and turquoise hydrogen will all play a role in the energy transition, and that both green and turquoise hydrogen may be the most enduring technologies of those considered here.
We suggest that the above indications give rise to two tentative conclusions. Firstly, that R&D&D funding at a massive scale makes more sense over the next 5-10 years than massive hydrogen production subsidies (tenders, CCfD’s[38], etc.). Secondly, ETS prices need to increase quickly to avoid very high production subsidies, and the industries that will use hydrogen need to be fully exposed to the ETS system (see below) before pursuing a subsidy-based approach.
6. Learning from experience in the RES-E sector
A key element of the Commission’s Hydrogen Strategy[39] is to ‘kick-start’ the supply of low and (in particular) zero carbon hydrogen, either through quotas or via production subsidies. With respect to the latter, the Commission’s Hydrogen Strategy refers to ‘contracts for difference’, granted almost exclusively through tenders by the Member States (using funds from the European Recovery Plan[40], Cohesion Funds[41] or nationally financed subsidies). Such a policy may have two distinct objectives. First, to lay the foundations for a future hydrogen market in terms of capacity, given the goal of complete decarbonisation by 2050. Second, to reduce the cost of renewable and low-carbon hydrogen production.
There are parallels here to the EU’s approach to renewable electricity in 2009. In order to drive down the cost of wind and PV the Commission focused to a certain extent on R&D activities (‘technology push’). However, the EU dedicated a far greater share of available funding to providing massive subsidies supporting new RES-E capacity (‘market pull’) in order to kickstart RES-E production. This had the explicit aim of catalysing renewable electricity installed capacity to provide a foundation for further growth, but equally to lower RES-E costs by generating manufacturing economies of scale.
One could argue that the same approach should be followed with respect to low and zero- carbon hydrogen, providing significant subsidies in the early stages of market development with the aim of reducing production cost. Certainly, economies of scale are important for low and zero-carbon hydrogen, and plant costs can be expected to reduce significantly with standardisation and improved technology. Nevertheless, it is reasonable to expect that a significant part of these economies can be captured through ambitious R&D&D funding, particularly given that hydrogen technology is not as sensitive to economies of scale as RES-E infrastructure, as it is a more highly centralised process. Furthermore, renewable electricity is a high CAPEX low OPEX sector, lower CAPEX investment costs are determinative in the resultant electricity price. Hydrogen, on the other hand, is (relatively speaking) low CAPEX high OPEX, meaning that reducing CAPEX will have a lesser effect in terms of cost reduction for hydrogen compared to renewable electricity. Massive production subsidies are unlikely to reduce OPEX costs for low and zero-carbon hydrogen as effectively as they did for RES-E.
In this light, it is important to consider carefully whether the use of significant public subsidies for decarbonised hydrogen production at an early stage of market development can be a logical use of public funds, if the objective is efficient cost reduction. Production subsidies during the early stages of market development may nevertheless be justified for other reasons, such as preparing the market.
7. Decarbonised hydrogen quotas require considerable care
Judging the speed of introduction for production subsidies and/or consumption quotas will require a careful balance of priorities, namely between (i) ensuring that the EU’s energy system evolves quickly enough to reach net-zero by 2050 and (ii) ensuring the competitiveness and security of EU energy markets.
For example, the timing and pace of planned decarbonised hydrogen penetration into the market will influence the risk of carbon leakage. Some key industries where decarbonised hydrogen should be used at scale are for fertiliser, methanol, and steel, as well as for high-heat energy-intensive industry (e.g., cement). These are all potential ‘carbon leakage’ sectors and therefore need to be protected through the newly announced CBAM. Application of minimum requirements for decarbonised gases is a good way to guarantee offtake, sending a signal to the demand side, however it should be highly targeted, with adequate protection for industry and consumers alike. This is particularly relevant in the context of the Fit for 55 package, which introduced requirements for renewable fuels of non-biological origin (RFNBOs), including renewable hydrogen and its derivatives. In its proposed re-cast of the Renewable Energy Directive[42], the Commission proposes an obligation on Member States to ensure that 50% of all hydrogen consumed in 2030 is of renewable origin.
This is a very difficult balance, and the purpose of this study is not to suggest a decisive answer, nor to propose a specific trajectory. It does aim, however, to illustrate the importance of taking an evidence-based and thoroughly considered approach to ensure a trajectory that will balance the imperative of achieving the Green Deal decarbonisation target, whilst protecting the interests of EU citizens in terms of competitive energy prices, jobs, and economic growth.
8. An ‘Internal Market for Hydrogen’ and ‘technology neutrality’
Not least, this study demonstrates the level of uncertainty of costs and technologies of different decarbonisation options for the EU moving forwards. Selectively picking different assumptions, one can argue that green, blue, or turquoise hydrogen will be the cheapest in 2030 or 2050. The real answer to this question is simply unknowable, as it depends on a number of sensitive factors. Including, (i) the cost of renewable electricity and its (ii) availability, (iii) the potential for imports of RES-E and/or hydrogen, (iv) electricity market prices, (v) new electricity infrastructure, (vi) gas prices, (vii) ETS prices, and (viii) technology developments.
The average figures for expected EU hydrogen cost in 2030 are (in €/Kg) green PV 3.6, green offshore wind 4.8, blue 2 and turquoise 3. The Commission has the objective in its Hydrogen Strategy (endorsed by Council and Parliament) that by 2030 8 Mt of green hydrogen would be produced. To do so using green hydrogen based on offshore wind (4.8) rather than blue (2) hydrogen would require (i) additional subsidies of €22.4 Bn per year compared to relying on blue hydrogen[43], (ii) produce potentially limited GHG savings (depending on capture rate of CCS), (iii) require large quantities of scarce renewable electricity that could be better used in direct electrification/transport, and thus (iv) infringe the Energy Efficiency First principle.
This is not to say that such figures are correct – the point is that they are unknowable. Equally, it is not to say that blue hydrogen should be prioritised over green. Rather that the EU should be technology neutral to the development of its hydrogen market. The Internal Market principle has served the EU well and should also be applied to hydrogen.
Furthermore, price is not the sole relevant factor – the additional GHG in blue hydrogen compared to green and turquoise needs to be reflected in any certification and accounted for in ETS declarations. R&D investments need to ensure that all useful technologies reach maturity and cost-reductions rapidly. It needs to be clear that only fully decarbonised hydrogen will be viable post-2050, with due planning for lock-in risks of ‘low carbon’ infrastructure and the technology cycles of different technologies.
Getting this balance right will be challenging, but the uncertainties identified in this study demonstrate that any policy based on ‘technology picking’ could result in significant and unnecessary costs.
Notes
[1] Jones, Kneebone, Pieblags, (2022). Cost-effective decarbonization study 2022
[2] Piebalgs, Jones, Dos Reis, Soroush, Glachant, (2020), Cost-effective Decarbonisation Study
[3] European Commission, (2021). Energy efficiency first
[4] Belmans, Dos Reis, Vingerhoets, (2021). Electrification and sustainable fuels: Competing for wind and sun
[5] For example, the EU was roughly halfway short of the 20% energy efficiency target outlined in the ’20-20-20’ energy objectives, until the COVID-19 pandemic hit and depressed overall consumption. 6 Zachmann, et al. (2021). Decarbonisation of Energy
[7] In this study we covered green hydrogen of different origins, blue hydrogen, and turquoise hydrogen. There are other kinds of decarbonised hydrogen such as pink hydrogen from nuclear electricity, however they are beyond the scope of this paper. For more information on the different kinds of decarbonised hydrogen and how they are produced see here.
[8] Collins, (2021). Green hydrogen currently cheaper to produce in Europe than grey and blue H2 due to high natural gas and carbon prices, Recharge News.
[9] Morgan, (2022). Rethink Energy forecast to 2050
[10] International Energy Agency, (2021). Gas Market Report, Q3-2021
[11] This is only in terms of LCOE for ‘additional’ generation to produce green hydrogen at the lowest possible cost, it does not consider factors such as operating hours.
[12] Rosende, Sauma, Harrison, (2019). Effect of Climate Change on wind speed and its impact on optimal power system expansion planning: The case of Chile
[13] See point 1 on the decarbonisation hierarchy.
[14] Although it is worth adding the caveat that pyrolysis is sensitive to price changes in the gas and electricity markets, whereas SMR and electrolysis are each only sensitive to one of these markets.
[15] The Business Research Company, (2021). Carbon And Graphite Product Global Market Report 2021
[16] Mordor Intelligence, (2021). Carbon Black Market – Growth, Trends, COVID-19 Impact, and Forecasts (2021-2026)
[17] Way, et al., (2021). Empirically grounded technology forecasts and the energy transition, University of Oxford
[18] Shell. Quest Carbon Capture and Storage (CCS) Project
[19] Smith, et al., (2021). The Cost of CO2 Transport and Storage in Global Integrated Assessment Modeling
[20] Howarth, Jacobson, (2021). How green is blue hydrogen?, Energy Science & Engineering
[21] Some supply chains have reported emission rates of as little as 0.2%, whereas others are above 10% when accounting for venting and flaring losses etc. See here.
[22] Methane is roughly 86x more potent as a climate forcing greenhouse gas than carbon dioxide over a 20-year timescale, roughly 28x more potent over 100 years. See here.
[23] Bruyn, et al., (2020). Energy-intensive Industries: Challenges and opportunities in energy transition, European Parliament
[24] I.e. on natural gas and renewable electricity prices.
25 Carbon border adjustment mechanism (CBAM). 26 Kakoulaki, et al., (2021). Green hydrogen in Europe – A regional assessment: Substituting existing production with electrolysis powered by renewables, https://www.sciencedirect.com/science/article/pii/S0196890420311766#:~:text=Today%20around%208.2%20Mt%20of,)%20in%20202 0%20%5B10%5D.&text=Initially%2C%20the%20study%20estimates%20the,hydrogen%20production%20and%20electricity%20dema nd 27 Steam methane reformer (SMR). 28 I.e. distributing or allocating efforts with a greater proportion at the beginning of the enterprise or process. 29 I.e. where other decarbonisation options are not available or cost prohibitive
[30] Collins, (2022). Turquoise hydrogen leader awarded $1bn US government loan to expand commercial facilities tenfold
[31] European Commission, (2021). Commission sets the carbon farming initiative in motion
[32] European Commission, (2020). Communication on Critical Raw Materials Resilience: Charting a Path towards greater Security and Sustainability COM(2020)474
[33] European Commission, (2020). EU strategy to reduce methane emissions
[34] Intergovernmental Panel on Climate Change, (2018). Underground geological storage
[35] Derwent, (2006). Global environmental impacts of the hydrogen economy, Int. J. of Nuclear Hydrogen Production and Applications, 1(1): 57-67
[36] Research, development and deployment (R&D&D).
[37] Also those not covered in this study, such as photocatalysis, nuclear powered electrolysis, saltwater electrolysis.
[38] Carbon Contracts for Difference (CCfD).
[39] European Commission, (2020). A hydrogen strategy for a climate-neutral Europe
[40] European Commission. Recovery plan for Europe
[41] European Commission. Cohesion Fund
[42] European Commission, (2021). Directive on the promotion of energy from renewable sources
[43] €2.8 (4.8-2)*8bn = €22.4bn.
Don’t miss any update on this topic
Sign up for free and access the latest publications and insights
More on the topic