

Hydrogen funding flows in the European Union 2023
A first attempt at visualising and mapping the funding flows for clean hydrogen projects in the EU.

The following three infographics are a first attempt at visualising and mapping the funding flows for clean hydrogen projects in the EU.
The maps are broken down into three general categories:
- EU-specific instruments
- Member State specific schemes
- Blended financing instruments
Each diagram has its own limitations, and they are non-comprehensive, particularly as regards the map on Member State specific schemes which just uses a few indicative examples.
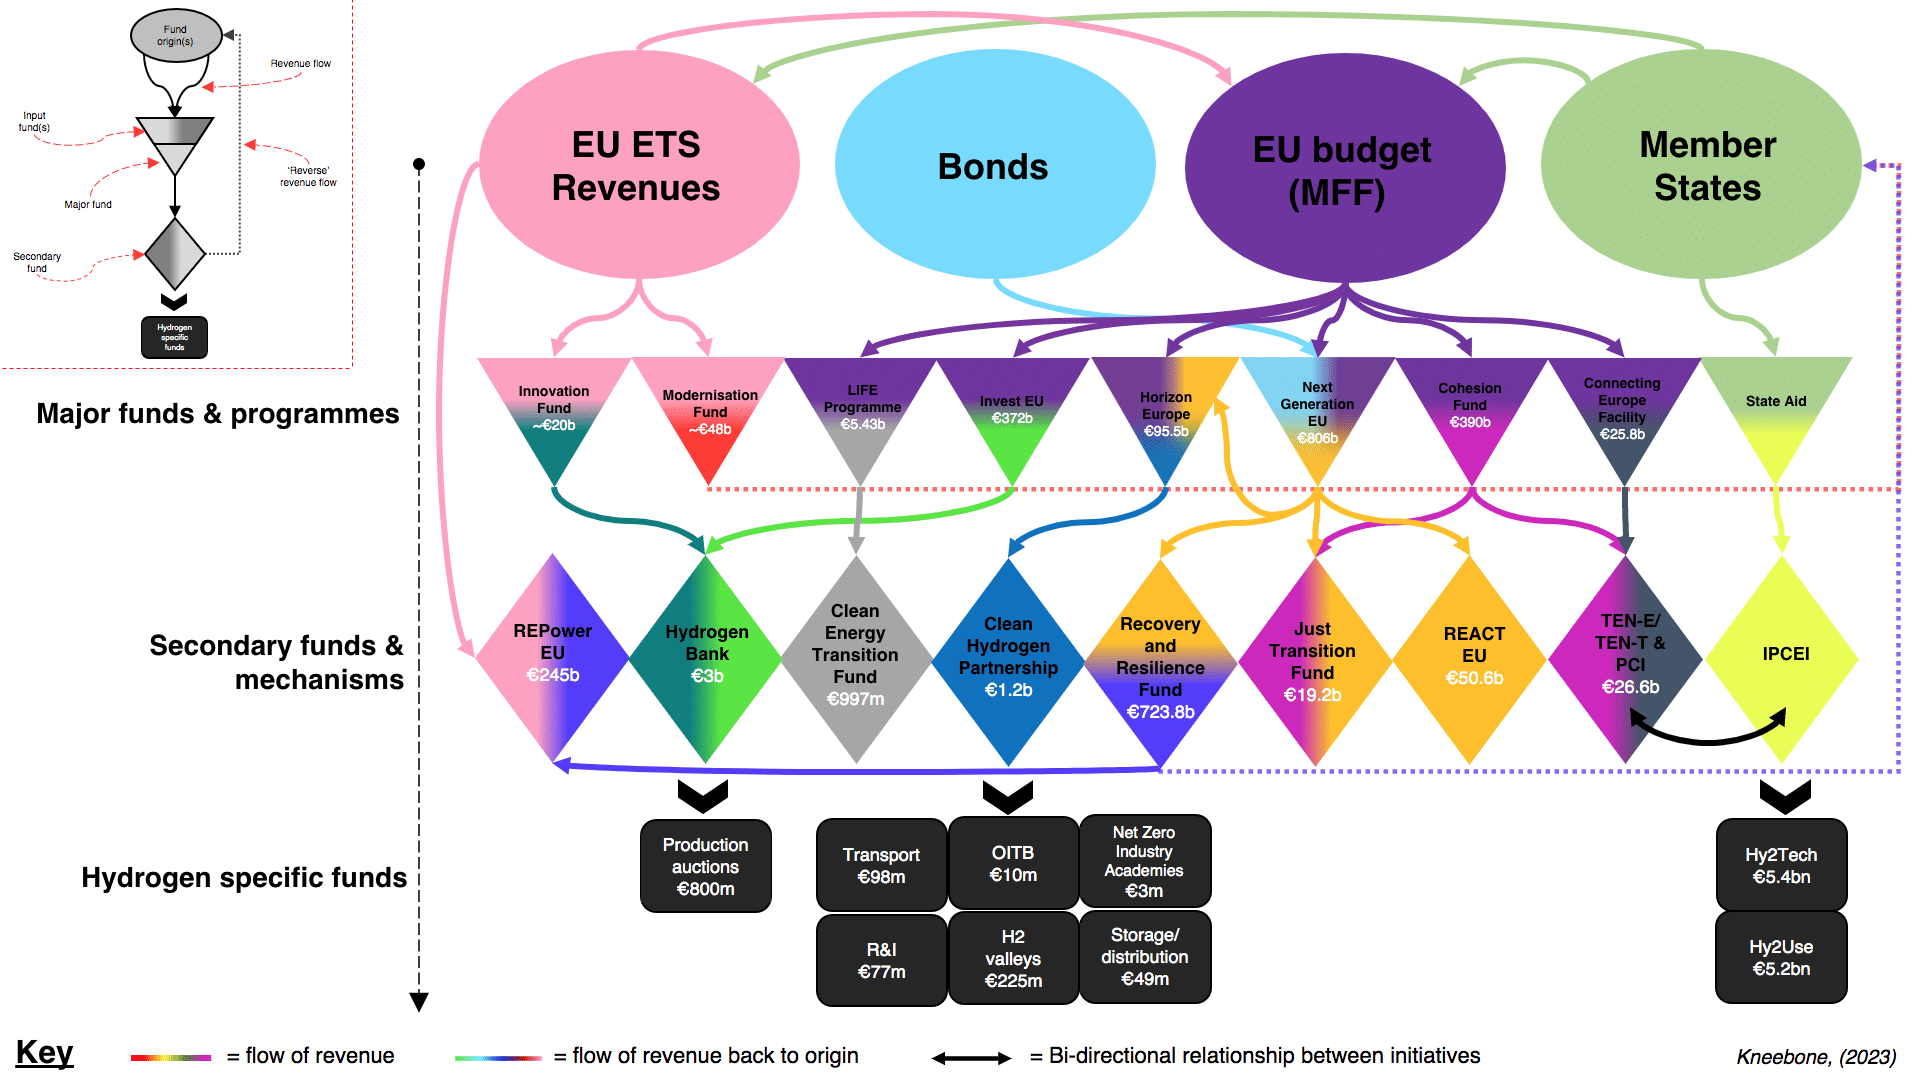
Map 1 on EU-specific instruments
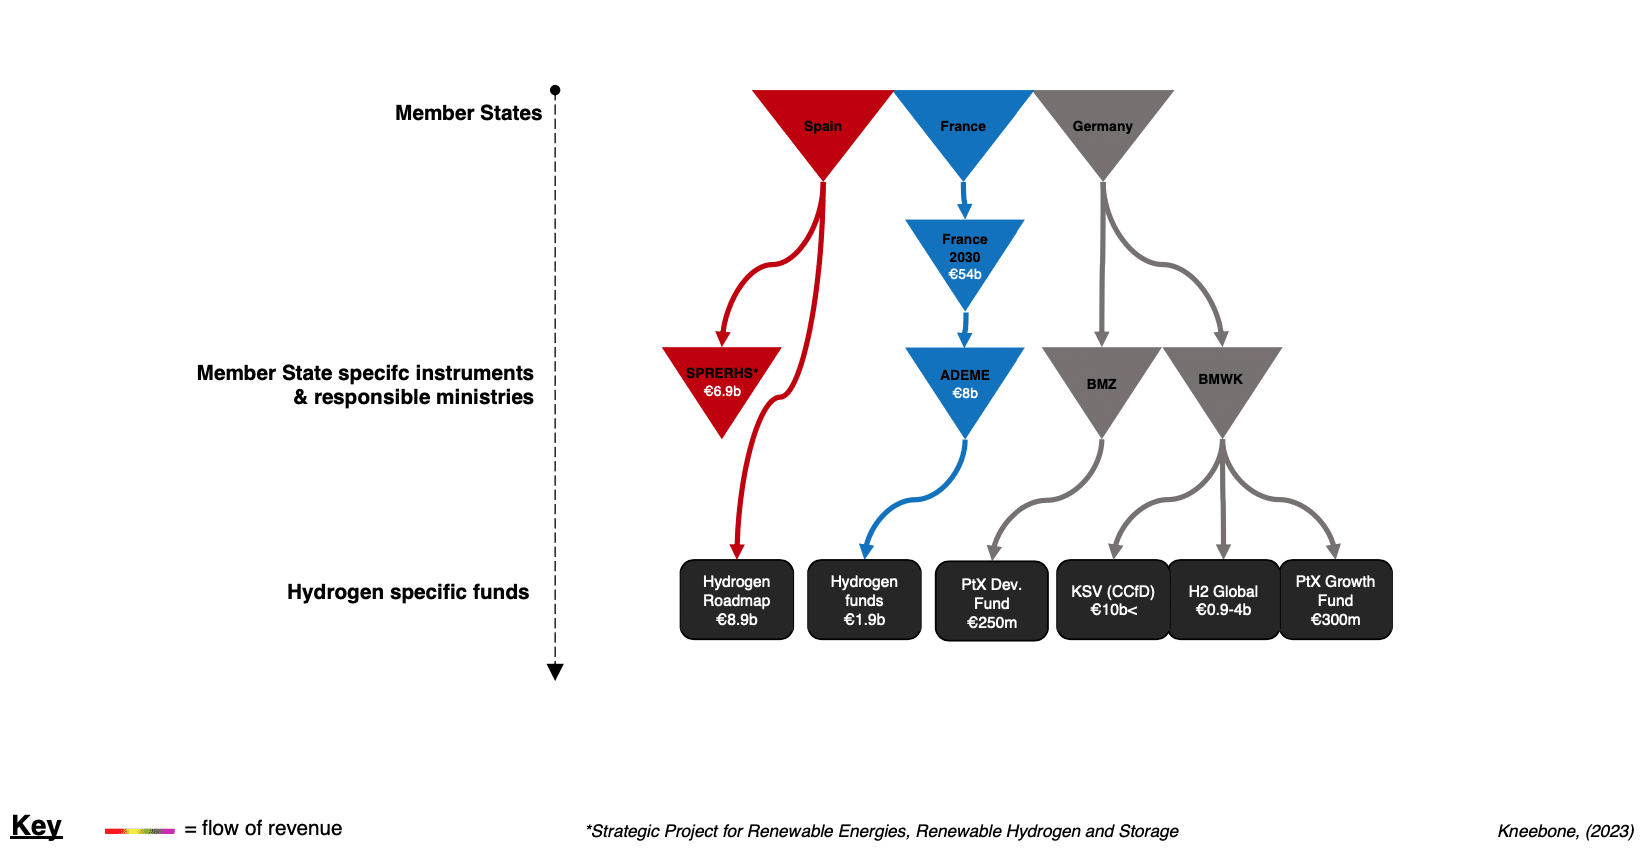
Map 2 on Member State-specific schemes
Map 3 on blended financing instruments
Logic
The structure of the maps in general follows a top-down logic, attempting to track Euros flowing through different macro-level mechanisms and frameworks into or towards hydrogen specific, and dedicated budgets. Nevertheless, the funding landscape in Europe is quite complex, and I concede that the results are not always totally elegant and or immediately intuitive to follow.
The colours are intended to make it easier to follow a single line of financing, and to illustrate the ‘mixing’ of revenue streams (e.g bonds and MFF budget). Where a mechanism has reached its final form (in terms of its pertinence to hydrogen funding) it is filled with the colour(s) of the fund(s) that facilitate it – e.g. the two shades of green of the Hydrogen Bank indicate that financing comes from the Innovation Fund and Invest EU. Where funds are repackaged under a new name and send Euros into subsequent mechanisms, they take on a new colour in the bottom half of their cell (e.g. Horizon Europe or Recovery and Resilience Fund). Where there are concrete and specific hydrogen budgets earmarked, for example the production auctions under the Hydrogen Bank or the German PTX development fund, the budget is indicated in a black square cell. Each map has slightly different ways of visualising and structuring these relationships, accounting for the nuances of the landscape, I describe the logic and specifics in a bit more detail below.
EU map
The EU specific map has a vertical top to bottom logic, beginning with the largest and least descript sources of funds at the top (e.g. EU MFF) or revenue generation mechanisms (e.g. ETS revenues or bonds) – what I refer to as finance ‘origin’. These flow vertically down into different ‘major funds & programmes’ – i.e. massive budgets with significant strategic but cross-sectoral ambitions such as the ‘Cohesion Fund’ or ‘Next Generation EU’ that often cover multiple sectors of the economy. In several examples these are fed by multiple budgets.
From here the Euros flow down into typically smaller and more specific ‘secondary funds & mechanisms’ more closely linked to energy sector decarbonisation. The relationship between these two layers of the map is a little complex, as there are also ‘horizontal’ links and flows of funding, for example between Next Generation EU and Horizon Europe or the Recovery and Resilience Fund and REPowerEU. There are also ‘relationships’ in terms of process but not in terms of financing, as is the case with TEN’s and the IPCEI processes – this is indicated with a solid black arrow. Similarly, State Aid and IPCEI do not have budgets in of themselves but are rather vehicles for accessing finance, here I indicate the approved funding for each round. Further complicating the picture are flows of revenue back to the origin sources – indicated with coloured dashed lines. In these cases, the funding mechanisms are essentially used to repackage and redistribute funds back to Member States and subsequent specific domestic companies and projects.
Member State Map
The Member State map is comparatively much simpler, illustrating just a few examples of Member States that are actively promoting hydrogen with their own domestic budgets. The countries indicated are Spain, France, and Germany. The logic and flow of the map is again top down and vertical. In this map the colours simply indicate the different Member States and the revenue flows from the domestic budget into large cross-sectoral initiatives (e.g. France 2030) and government ministries who manage those funds. From there, the specific hydrogen targeted initiatives are specified along with their budget. Where it was not clear which ministries control the funds, the budget is linked to the Member State itself directly.
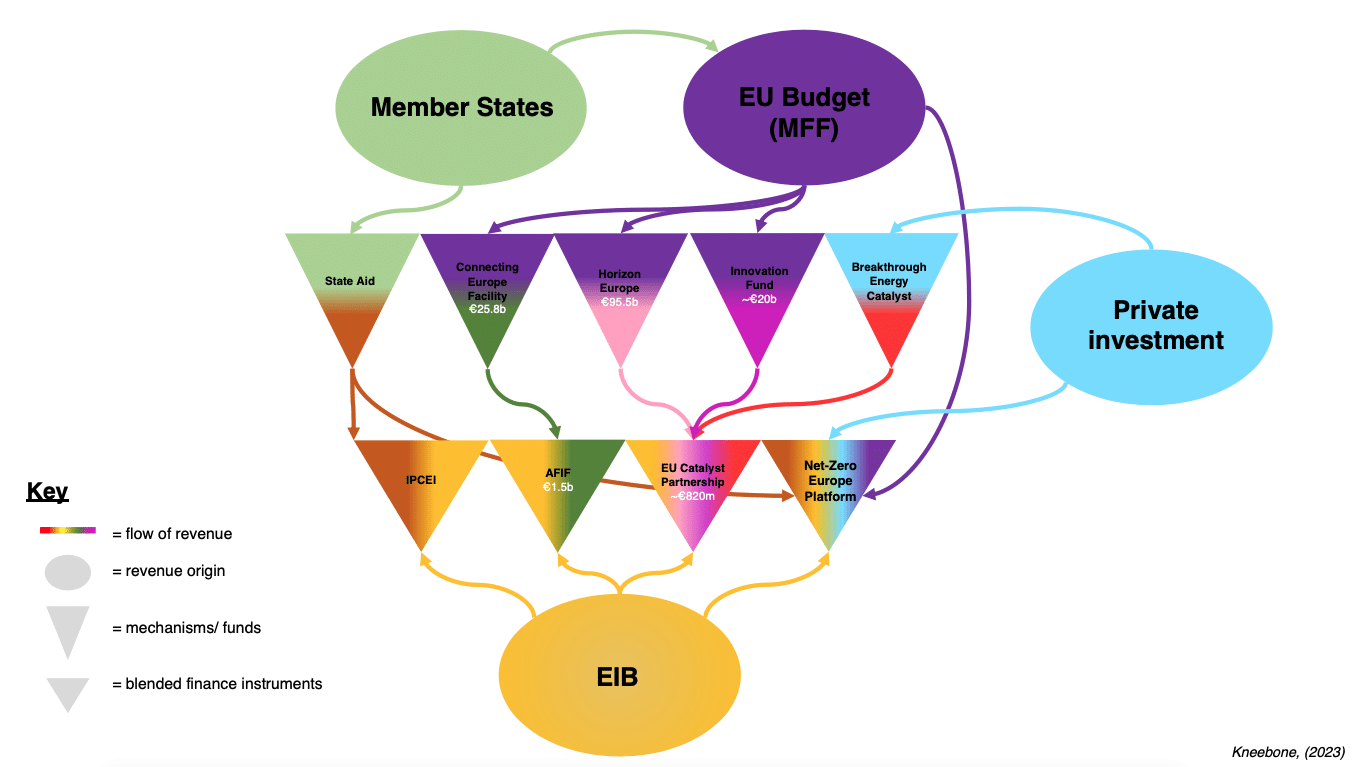
Blended financing instruments
The EU institutions also use investment vehicles like the ‘Breakthrough Energy Catalyst’ to collaborate with major private investment groups, helping to target and amplify investment in key areas of interest. There is also a significant role for the EIB and others to contribute to strategic infrastructure, particularly for projects that are earmarked as strategically important within Europe’s IPCEI framework. The blended financing instruments map helps to illustrate some of the major relationships here, but does not always follow the same vertical, top-down logic as the other maps. This is partly for ease of illustration and interpretation given the complexity of the flows, but also because the EIB for example is largely providing finance from its general budget rather than under a given mechanism. However, the EU’s contributions to blended financing mechanisms is always via its specific funding programmes, and as such these hierarchies are specified with the usual coloured flows. Likewise, the colours of the individual cells also correspond to the origin of financing.
Your feedback is welcome!
The maps are a work in progress and may include errors, they also do not constitute financial advice. The maps are also not comprehensive, particularly for the Member State specific and blended finance maps, which are intended predominantly to illustrate some of the major relationships. Feedback is more than welcome, and I appreciate the input I already received from colleagues to improve comprehensiveness and clarity.
For a closer look, download the 3 maps
To share your comments and give input on how to improve the maps, get in touch with James Kneebone
Don’t miss any update on this topic
Sign up for free and access the latest publications and insights
More on the topic