


EU Emission Trading System (EU ETS)
What is the EU ETS? What is the cap-and-trade mechanism? Which gases and sectors are covered by it? And how does it contribute to the EU Green Deal?

Set up in 2005, the EU Emissions Trading System (EU ETS) is the cornerstone of the European climate policy, covering about 36% of total EU GHG emissions in 2022 (European Commission, 2023). While the EU ETS was the first large emissions trading scheme in the world, many more countries have been adopting ETSs in the past years. As of the beginning of 2023, there are 28 operational emissions trading systems around the world (ICAP, 2023).
The EU ETS follows the ‘polluters-pay-principle’, whereby firms covered by the ETS need to purchase an emissions allowance for each tonne of CO2-eq they inject into the atmosphere. In this respect, the EU ETS is a carbon pricing mechanism, like a carbon tax. Two main features distinguish an ETS from a carbon tax. Firstly, a carbon tax fixes the price for polluting but the amount of CO2-eq abated by the measure is uncertain. By contrast, the EU ETS follows the cap-and-trade approach: it sets an emissions cap, imposing an upper bound to emissions. The price of allowances is determined by the market and is thus variable. Secondly, firms covered by the EU ETS can trade allowances between themselves, so that less-polluting firms requiring fewer allowances can sell them to more carbon-intensive ones. As explained in more detail further below in this article, some of the firms participating in the EU ETS also receive free allowances according to efficiency benchmarks which reward the most efficient installations.
The emissions cap of the EU ETS decreases at a yearly rate, called the Linear Reduction Factor (LRF). The LRF is currently set at 2.2% of the 2010 baseline and will increase to 4.3% from 2024 to 2027 and to 4.4% from 2028. Relatively to its launch in 2005, the EU ETS achieved a 21% reduction of regulated emissions in 2020 and is set to enforce a 62% reduction by 2030.
As part of the EU ‘Fit-for-55 package’ the EU ETS was revised to align it with the EU’s overall objective of reducing net emissions by at least 55% by 2030 compared to 1990 levels. A set of legislative proposals relating to the EU ETS was adopted on 10 May 2023. The reformed EU ETS Directive (2003/87/EC) increased the emissions reduction target and stipulated that emissions from the EU ETS sectors must be 62% below 2005 levels by 2030, a significant increase of the 43% required under previous legislation. The revised Directive also extended the scope of the EU ETS to include the emissions from maritime transport. Shipping companies are obliged to surrender allowances starting with 40% from 2024 and reaching 100% in 2026. By the end of 2026, the European Commission will also assess whether to introduce emissions from municipal waste incineration into the EU ETS from 2028.
Furthermore, the recast Directive foresees that a new separate EU ETS 2 for road transport and buildings fuels, as well as for process heat in small-scale industry, will come into force in 2027. The EU ETS 2 is meant to reduce greenhouse gas emissions in these sectors by 43% by 2030 compared to 2005 levels. As compared to the existing EU ETS, under the EU ETS 2 all allowances will be auctioned, and none will be handed out for free. The new system will apply to fuel distributers, but it is likely that some of the costs will be passed on to consumers. For this reason, the start of the EU ETS 2 could be delayed to 2028 if energy prices are deemed exceptionally high. In addition, part of the revenue from the auctions will be used to support vulnerable households and micro-enterprises through a dedicated Social Climate Fund. The Social Climate Fund is expected to raise 65 billion EUR from the auctions of the EU ETS 2 which are to take place during the period 2026-2032. Approximately 5 billion EUR will be added from the auctioning of 50 million allowances under the EU ETS 1 and Member States will contribute 25% of their own resources, making a total of around 86.7 billion EUR available for social compensation. These revenues are to be used for investments in more efficient buildings and lower-emission mobility and to finance direct temporary income support to vulnerable households, transport users and micro-enterprises.
Which gasses and sectors are covered by the EU ETS?
The EU ETS covers greenhouse gases from specific activities, such as carbon dioxide (CO2) from electricity and heat generation, from energy-intensive industry sectors (i.e. oil refineries, steel works, and production of iron, aluminium, metals, cement, lime, glass, ceramics, pulp, paper, cardboard, acids and bulk organic chemicals), from aviation within the European Economic Area and, starting in 2024, from maritime transport. This concerns specifically 50% of emissions from maritime transport starting or ending outside the EU and 100% of emissions from transport between two EU ports and while ships are in EU ports. Additionally, the EU ETS covers nitrous oxide (N2O) from production of nitric, adipic and glyoxylic acids, as well as from maritime transport starting from 2024, and glyoxal perfluorocarbons (PFCs) from the production of aluminium. Methane (CH4) will be included in the Monitoring, Reporting and Verification (MRV) Maritime Regulation from 2024 and in the EU ETS from 2026.
How are the allowances allocated?
The EU ETS has undergone many substantial reforms since its implementation. One of the most relevant changes concerns the allocation of allowances, which in Phase I (2005-2007) and II (2008-2012) was decentralised and mainly relied on free allocation. Since Phase III (2013-2020), the total volume of emission allowances is determined at the EU level, a single set of rules governs their allocation, and auctioning is the dominant allocation mechanism. The rules for the remaining share of free allocation of allowances have been further revised for Phase IV (2021-2030). Free allowances are generally allocated according to the risk of carbon leakage for each sector, i.e. the risk of firms delocalising production in a country where environmental regulation is less strict. According to the rules for Phase IV, free allocation focuses on those sectors most at risk of carbon leakage as determined by the European Commission. Only the sectors deemed to be at the highest risk of relocating their production outside of the EU receive all their allowances for free. Based on specific energy efficiency benchmarks, less exposed sectors will receive a decreasing number of free allowances starting from 2026 until the complete phase-out in 2030. As for the power sector, generators must buy all their allowances since Phase III, with derogations for three lower-income Member States (Bulgaria, Hungary, and Romania). Installations in the industrial sector are given free allowances depending on their efficiency relative to the 54 product-specific benchmarks (52 product and 2 fallback approaches based on heat and fuel) outlined by the European Commission. These benchmarks are based on 1) process emissions; 2) heat consumption; or 3) fuel consumption. As a rule, the benchmark corresponds to the average performance of the 10% most efficient installations. The benchmarked emissions are calculated by multiplying the relevant benchmark by the installation’s recent output level. Furthermore, as there exists a maximum number of allowances that can be freely allocated at the EU level, a uniform cross-sectoral correction factor is applied to all installations, so that the final allocation of free allowances does not fully cover all benchmarked emissions.
Finally, special allocation rules hold for the aviation sector, with 82% of allowances freely allocated, 15% auctioned, and 3% withheld for new entrants and fast-growing companies. It is estimated that, in Phase III, 43% of total allowances were freely allocated, the rest (57%) were auctioned by the Member States. The number of free allowances allocated to aircraft operators will also be reduced progressively to reach full auctioning by 2027.
Historical trend of allowance prices
The price of EU allowances (EUAs) has undergone significant variations since its very first phases, as can be seen in the figure below. Firstly, in 2006, the first publication of verified emissions revealed that regulated installations had been overallocated, causing an abrupt fall in demand. Secondly, the 2008 Global Financial Crisis hit the EU ETS hard, with the shrunken aggregate demand carrying over the carbon market. Subsequently, EUA prices further declined and then stagnated for some years, due to the combined effect of the overallocation and effective companion policies. Indeed, national policies fostering the deployment of renewables and the increase in energy efficiency reduced the demand for allowances by polluting firms.
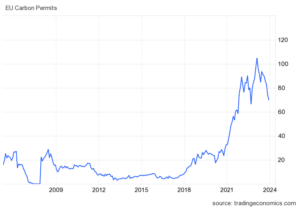
Figure 1: EU Carbon Permits (EUR) from 2005 – 2023
Because of all these effects, by the start of Phase III (2013), the EU ETS had accumulated a surplus of about two billion allowances (more than the total volume of annual emissions under the EU ETS). As expected, this large allowance surplus severely depressed EUA prices. In 2012, the European Commission started tackling the problem by postponing the auctioning of 900 million allowances from 2014-2015 to 2019-2020, a measure known as ‘backloading’. However, as further action proved necessary the Market Stability Reserve (MSR) was made operational in January 2019 and the backloaded allowances were transferred to the MSR as an initial reserve.
The EUA price started to increase in 2020, reaching the symbolic value of 100 €/tonne in February 2023. This increase can be explained by many different factors, including the rise in gas prices, the more stringent rules in Phase IV of the EU ETS, and the announcement of the EU Green Deal. A suspicion of price manipulation from financial actors emerged with the increased volatility that accompanied the rise in price. These claims do not appear to be substantiated so far (ECB, 2022; ESMA, 2022). After the start of the war in Ukraine at the end of February 2022, the price crashed dramatically and experienced a period of instability. Since the beginning of 2023, the prices have picked up again and are averaging 80 €/tonne.
How does the Market Stability Reserve stabilize allowance prices?
Since 2019 the Market Stability Reserve (MSR) operates as a long-term mechanism to adjust the number of EU allowances in circulation. The aim of the MSR is to improve the system’s resilience to supply and demand imbalances and to prevent a growing surplus of allowances (i.e., the difference between the number of allowances available for compliance at the end of a given year, and the number of allowances effectively used for compliance with the emissions up to that given year).The surplus, known as the Total Number of Allowances in Circulation (TNAC), is published annually and determines whether the MSR recalls or releases allowances for auction.
In the context of the latest EU ETS revision, it was decided that the existing 24% rate of intake to be added to the reserve will be prolonged until 2030. Furthermore, the volume of allowances in the MSR which exceeds the volume auctioned in the previous year will be invalidated and the total number of allowances in the MSR will be limited to 400 million starting from 2023. These factors will effectively tighten the EU ETS cap. Additionally, the aviation and maritime sectors will be included in the calculation of the TNAC. The MSR is reviewed every five years by the European Commission, with the last review taking place in 2021.
Carbon leakage and the Carbon Border Adjustment Mechanism (CBAM)
So far, little scientific evidence supports the hypothesis that the EU ETS is directly linked to carbon leakage, mainly due to the past low–to–moderate allowance prices (Verde, 2020). However, as the allowance price has risen significantly, the risk of carbon leakage could increase accordingly.
Until Phase III (2013-2020), the identification of the sectors at risk of carbon leakage relied on two sectoral indicators computed at the EU level: Carbon Cost Intensity (CCI) and Trade Intensity (TI). The former measured the carbon costs relative to gross value added, whereas the latter measured the trade value relative to the size of the European market. To be classified as at risk of carbon leakage, firms needed to exceed 30% in either of the two or 5% in CCI and 10% in TI.
As of Phase IV (2021-2030), a different rule is being applied to identify the sectors at risk of carbon leakage. Specifically, a sector is classified as being at risk of carbon leakage if the product of the Carbon Emissions Intensity Indicator (CEI) (expressed in terms of kgCO2 per Euro of gross value added) and the TI indicator exceeds 20%. In addition, an adjustment to free allowances allocation is applied in cases of annual output variations exceeding +/-15%.
A first list of sectors at risk of carbon leakage – the ‘carbon leakage list’ – was defined in 2009 by the European Commission for the years 2013 and 2014. Out of 258 sectors, 165 were classified as being at risk. The second list was defined in 2014 for the years 2015–2019 and later extended to cover 2020. A third list was adopted in 2019 to cover Phase IV, with only 63 sectors still being classified as being at risk (European Commission, 2019).
To address the risks of carbon leakage, the Council and Parliament introduced the Carbon Border Adjustment Mechanism (CBAM), a tariff on carbon-intensive goods imported from abroad, in the ETS reform. On 16 May 2023, the regulation of the Council of the European Union and European Parliament implementing the CBAM came into force. Starting in 2026, importers in sectors covered by CBAM (cement, aluminium, fertilizers, electricity, hydrogen, iron and steel, along with some precursors and downstream products) will be required to surrender newly created CBAM certificates equivalent to the embedded emissions of their products unless the exporting jurisdiction has an equivalent carbon pricing system in place.
The free allocation of ETS allowances will be gradually phased out over a nine-year period (from 2026 to 2034) for sectors covered by CBAM. For non-CBAM sectors, the European Commission will determine the level of phase out of free allocations during the benchmark exercise. Under the current legislation, the Phase IV benchmarks were to be reduced by an annual minimum rate of 0.2% up to a maximum rate of 1.6%. In addition, installations receiving free allocation are obliged to implement energy audits or energy management recommendations. The 20% worst performers in a benchmark curve will be required to implement decarbonisation plans.
Related links
FSR Climate Publications
- Antoci, A. et al. (2021). Should I stay or should I go? Carbon leakage and ETS in an evolutionary model. Energy Economics, 103(105561). https://doi.org/10.1016/j.eneco.2021.105561
- Borghesi, S. et al. (2023). The market stability reserve in the EU emissions trading system: a critical review. Annual review of resource economics, 15(1), pp. 131-152. https://hdl.handle.net/1814/75985
- Borghesi, S. et al. (2020). Climate and energy policies after COVID‐19 [Perspectives on the economics of the environment in the shadow of Coronavirus]. Environmental and resource economics, 2020(76), pp. 501–503. https://hdl.handle.net/1814/68237
- Borghesi, S., Ferrari, A. (2023). Carbon pricing and social acceptability: using EU ETS auction revenues for social expenditures in a changing world. In Gollier, C. and Rohner, D. (Eds.), Peace not pollution: how going green can tackle climate change and toxic politics (pp.41-48). London: CEPR Press. https://hdl.handle.net/1814/75802
- Verde, S. (2020). The impact of the EU emissions trading system on competitiveness and carbon leakage: the econometric evidence. Journal of economic surveys, 34(2), pp. 320-343. https://hdl.handle.net/1814/66267
FSR Climate projects on the EU ETS
External Sources
- Commission Delegated Decision (EU) 2019/708. Commission Delegated Decision (EU) 2019/708 of 15 February 2019 supplementing Directive 2003/87/EC of the European Parliament and of the Council concerning the determination of sectors and subsectors deemed at risk of carbon leakage for the period 2021 to 2030. URL: EUR-Lex – L:2019:120:FULL – EN – EUR-Lex (europa.eu)
- Directive 2003/87/EC. Directive 2003/87/EC of the European Parliament and of the Council of 13 October 2003 establishing a system for greenhouse gas emission allowance trading within the Union and amending Council Directive 96/61/EC. EUR-Lex – 02003L0087-20230605 – EN – EUR-Lex (europa.eu)
- European Central Bank (2022). Update on economic, financial and monetary developments. ECB Economic Bulletin, Issue 3/2022. Economic Bulletin Issue 3, 2022 (europa.eu)
- European Commission (2023). Report from the Commission to the European Parliament and the Council on the functioning of the European carbon market in 2022 pursuant to Articles 10(5) and 21(2) of Directive 2003/87/EC. COM_2023_654_1_EN_ACT_part1_CMR+SWD.pdf (europa.eu)
- European Securities and Markets Authority (2022). Final Report – Emission allowances and associated derivatives. URL: Economic Bulletin Issue 3, 2022 (europa.eu)
- ICAP (2023). Emissions Trading Worldwide: Status Report 2023. Berlin: International Carbon Action Partnership. URL: ICAP Emissions Trading Worldwide 2023 Status Report_0.pdf (icapcarbonaction.com)
- Regulation (EU) 2023/955. Regulation (EU) 2023/955 of the European Parliament and of the Council of 10 May 2023 establishing a Social Climate Fund and amending Regulation (EU) 2021/1060. EUR-Lex – 32023R0955 – EN – EUR-Lex (europa.eu)
Don’t miss any update on this topic
Sign up for free and access the latest publications and insights